



Gold Price Outlook: Pullback Potential into FOMC
Gold prices put in a strong breakout after last week’s ECB rate decision and hopes for a 50 bp cut from the Fed have likely helped to drive the move. The big question now is ‘what’s next?’
Share this:

Gold Talking Points:
- Gold has shown another astounding topside trend to push towards the $2600 psychological level.
- Markets are currently showing a stronger probability for a 50 bp cut today and that getting priced-in has likely played a role in Gold’s advance. But if the bank goes for 25 instead and chooses to use the dot plot matrix to buffer that, there could be a case for mean reversion in those prior themes which could allow for a deeper pullback for Gold prices.
- I’ll be looking into these setups in the Tuesday webinar and you’re welcome to join, click here for registration information.
It’s been an astoundingly strong year for gold prices so far in 2024. And undeniably one of the major driving factors has been the shift amongst global central banks into a move-dovish posture. As a case in point, Gold was battling at the 2500 level for a few weeks until last week’s rate cut from the ECB, which helped to produce yet another bullish breakout in the metal as prices made a forward-advance towards the $2600 level. But so far this week bulls have shied away from a test of that big figure and, at this point, the move is starting to look a bit frothy on the long side.
On the image below, we can see where RSI on the weekly chart of Gold has pushed back into overbought territory. This isn’t necessarily a death knell for gold prices as the prior instance of the same saw price continue to accelerate for a few weeks after. But this does highlight the fact that the move is already a bit long-in-the-tooth and chasing at current levels could be a challenge.
Gold Weekly Price Chart
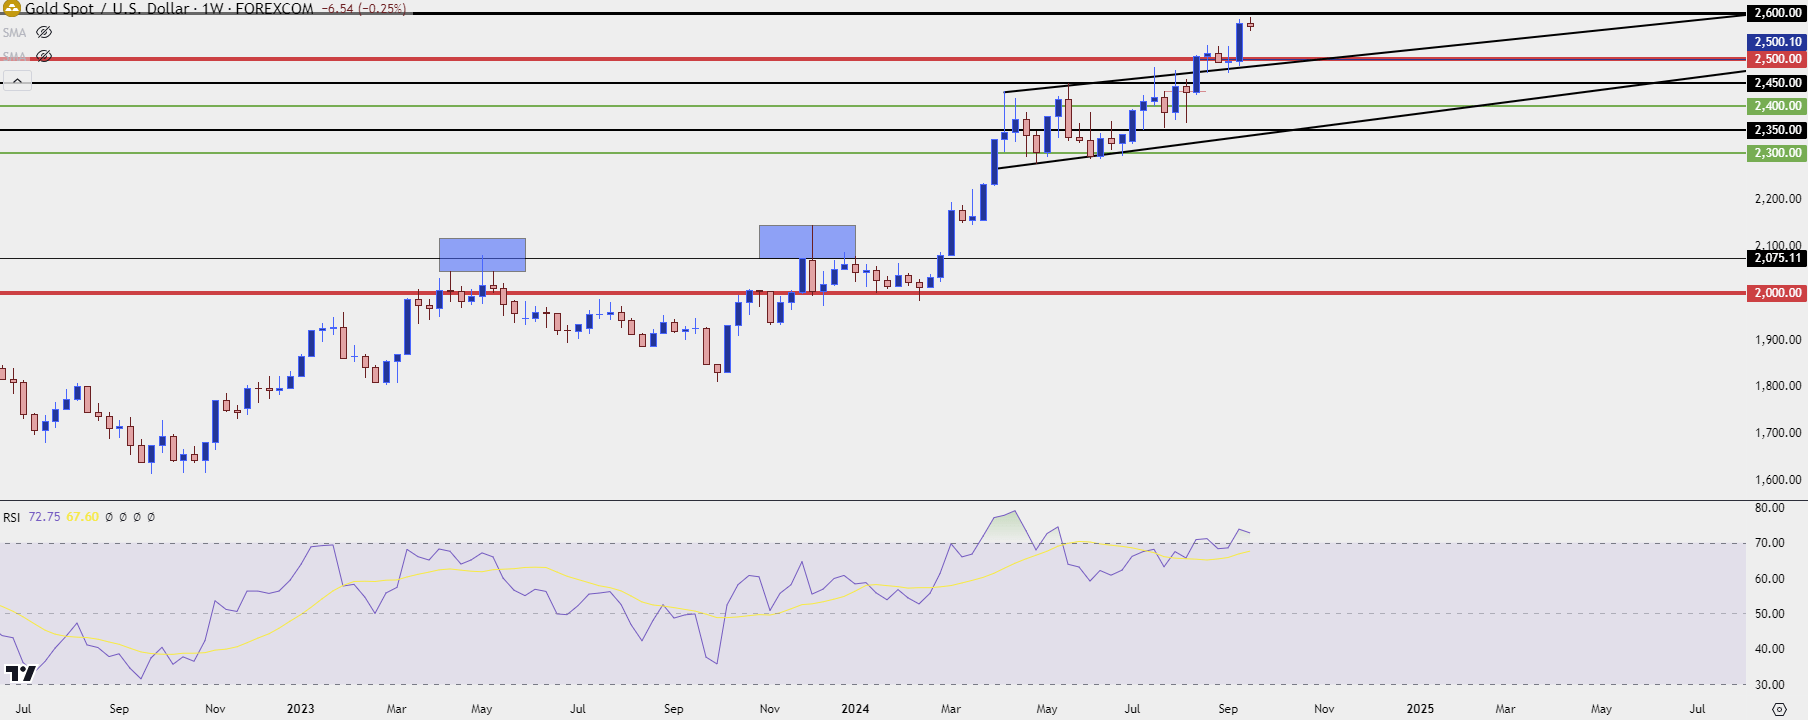 Chart prepared by James Stanley; data derived from Tradingview
Gold Pullbacks in 2024
Perhaps most impressive around gold so far this year has been the pullback episodes. Given the degree of breakout that was seen in the March-April episode, there would normally be considerable motive for profit taking from longs. But that didn’t hit very hard and if anything, that pullback looked rather shallow as buyers simply built-in defense of the $2300 level. That led to another breakout in August and, similarly, pullbacks remained rather light. Price did test prior range resistance as fresh support over a couple of different instances but that then led into the September ramp that set a fresh high on Monday.
At this point it seems difficult to chase the move-higher. This is also something I wouldn’t want to get very bearish around at this point as all that we’ve seen is a herculean effort by bulls. But – this does highlight pullback potential into FOMC, particularly if we get the 25 bp cut scenario.
In yesterday’s webinar I shared a few levels of interest for such. The Fibonacci retracement produced by the September move has a 23.6% retracement at 2561 and, so far, that’s held the low from the pullback.
The 50% retracement of that same move is confluent with 2531, which was prior range resistance, and that remains of particular interest.
But there’s also the $2544 level which I’m considering as confluent with the $2550 minor psychological level. If bulls show up there and hold the low today, that would be an indication that they were unwilling to wait for support at prior resistance, and that could be read as another bullish item for gold price action.
Gold Four-Hour Price Chart
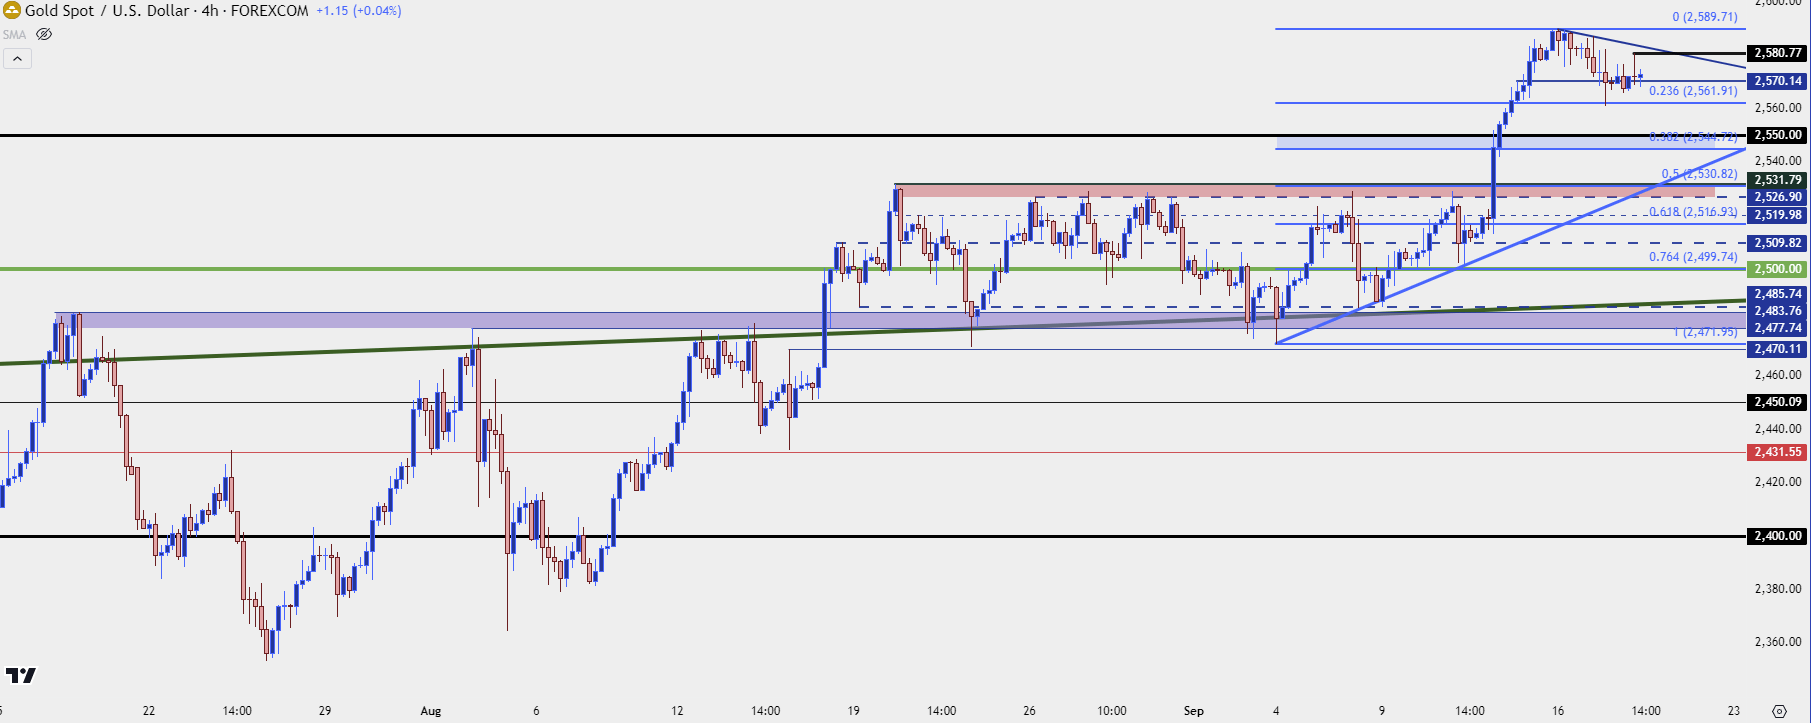 Chart prepared by James Stanley; data derived from Tradingview
--- written by James Stanley, Senior Strategist
Related tags:
Latest market news




Open an account in minutes
Experience award-winning platforms with fast and secure execution, and enjoy tight spreads from 0.5 pts on FX and 0.3 pts on indices.
Economic calendar
Web Trader platform
Our sophisticated web-based platform is packed with features.
Related articles
Gold Price Outlook: XAU/USD Resistance at $4200 Sets Up for NFP
It was a strong sell-off to start the week in gold and despite a Tuesday bounce, sellers are continuing to push following a resistance hit at the $4200 level.
Nasdaq Breakout Potential into Q4 for Melt Up Scenarios
The headlines seem negative in almost any place that you look, with surging Treasury yields and frothy AI valuations getting more and more attention. But, if it’s so bad, why hasn’t the Nasdaq melted down yet, even as the Fed has started hiking rates?

The RBA Hiked Rates and the Australian Dollar Still Fell
AUD/USD fell after the RBA rate hike because the central bank's hawkish stance was already priced in while the U.S. dollar stayed firm.

This report is intended for general circulation only. It should not be construed as a recommendation, or an offer (or solicitation of an offer) to buy or sell any financial products. The information provided does not take into account your specific investment objectives, financial situation or particular needs. Before you act on any recommendation that may be contained in this report, independent advice ought to be sought from a financial adviser regarding the suitability of the investment product, taking into account your specific investment objectives, financial situation or particular needs.
StoneX Financial Pte. Ltd., may distribute reports produced by its respective foreign entities or affiliates within the StoneX group of companies or third parties pursuant to an arrangement under Regulation 32C of the Financial Advisers Regulations. Where the report is distributed to a person in Singapore who is not an accredited investor, expert investor or an institutional investor (as defined in the Securities Futures Act), StoneX Financial Pte. Ltd. accepts legal responsibility to such persons for the contents of the report only to the extent required by law. Singapore recipients should contact StoneX Financial Pte. Ltd. at 6826 9988 for matters arising from, or in connection with the report.
In the case of all other recipients of this report, to the extent permitted by applicable laws and regulations neither StoneX Financial Pte. Ltd. nor its associated companies will be responsible or liable for any loss or damage incurred arising out of, or in connection with, any use of the information contained in this report and all such liability is hereby expressly disclaimed. No representation or warranty is made, express or implied, that the content of this report is complete or accurate.
StoneX Financial Pte. Ltd. is not under any obligation to update this report.
Trading CFDs carries a high level of risk that may not be suitable for some investors. Consider your investment objectives, level of experience, financial resources, risk appetite and other relevant circumstances carefully. The possibility exists that you could lose some or all of your investments, including your initial deposits. If in doubt, please seek independent expert advice. Visit www.forex.com/en-sg/terms-and-policies for the complete Risk Disclosure Statement.