


Nasdaq Breakout Potential into Q4 for Melt Up Scenarios
The headlines seem negative in almost any place that you look, with surging Treasury yields and frothy AI valuations getting more and more attention. But, if it’s so bad, why hasn’t the Nasdaq melted down yet, even as the Fed has started hiking rates?
Share this:

Nasdaq 100 Talking Points:
- Going into the rate hike two weeks ago there was a legitimate shot of a larger market sell-off, taken from the fact that the Nasdaq 100 had started to lag behind the S&P 500 since Kevin Warsh’s first meeting at the Fed.
- From the 2022 lows, tech and AI have very much been a driving force. If that begins to shift, particularly as yields fly higher and worries grow of a more-hawkish push at the Fed, the argument for lower stock prices can gain hold.
- In the aftermath of the rate hike, however, we’ve seen bulls come back in a very big way as the Nasdaq 100 set a fresh high, and going into Q4, there’s an inverse head and shoulders pattern that opens the door for a ‘melt up scenario’ that could run into another Santa Rally.
If trading were as simple as riding the headlines, traders would have fewer problems to deal with. And, to be sure, in many instances those headlines can help to shape market behaviors which, in-turn, influence prices. But, this doesn’t happen all the time and for the emotional trader without a plan, guiding decisions on the basis of headline flow, they can be put in the usual position of chasing their own tails.
At this point, the headlines seem dire. The risks are obvious. And, frankly, it can even be difficult to twist all of that into a bullish or optimistic argument. Yet, despite all that, stocks just continue to punch higher.
As we go into Q4 both the Nasdaq 100 and the S&P 500 show bullish potential, even as the Dow and Russell 2000 have lagged behind. Given the rate sensitivity of smaller cap companies, that makes sense for the Russell but the fact that equity buyers have just continued to push into the long side of stocks illustrates that, perhaps, something else is going on, and maybe market participants are looking beyond the current avalanche of risks.
Q4 will be big as mid-terms bring the possibility of change, and at this point, it seems that’s the widespread expectation. Bears have had ample opportunity to run with pullbacks but, so far, buyers have just continued to respond to pullbacks and support, and as we go into the Q4 open tomorrow’ there’s bullish breakout setup showing prominently in the index.
Nasdaq 100 Daily Chart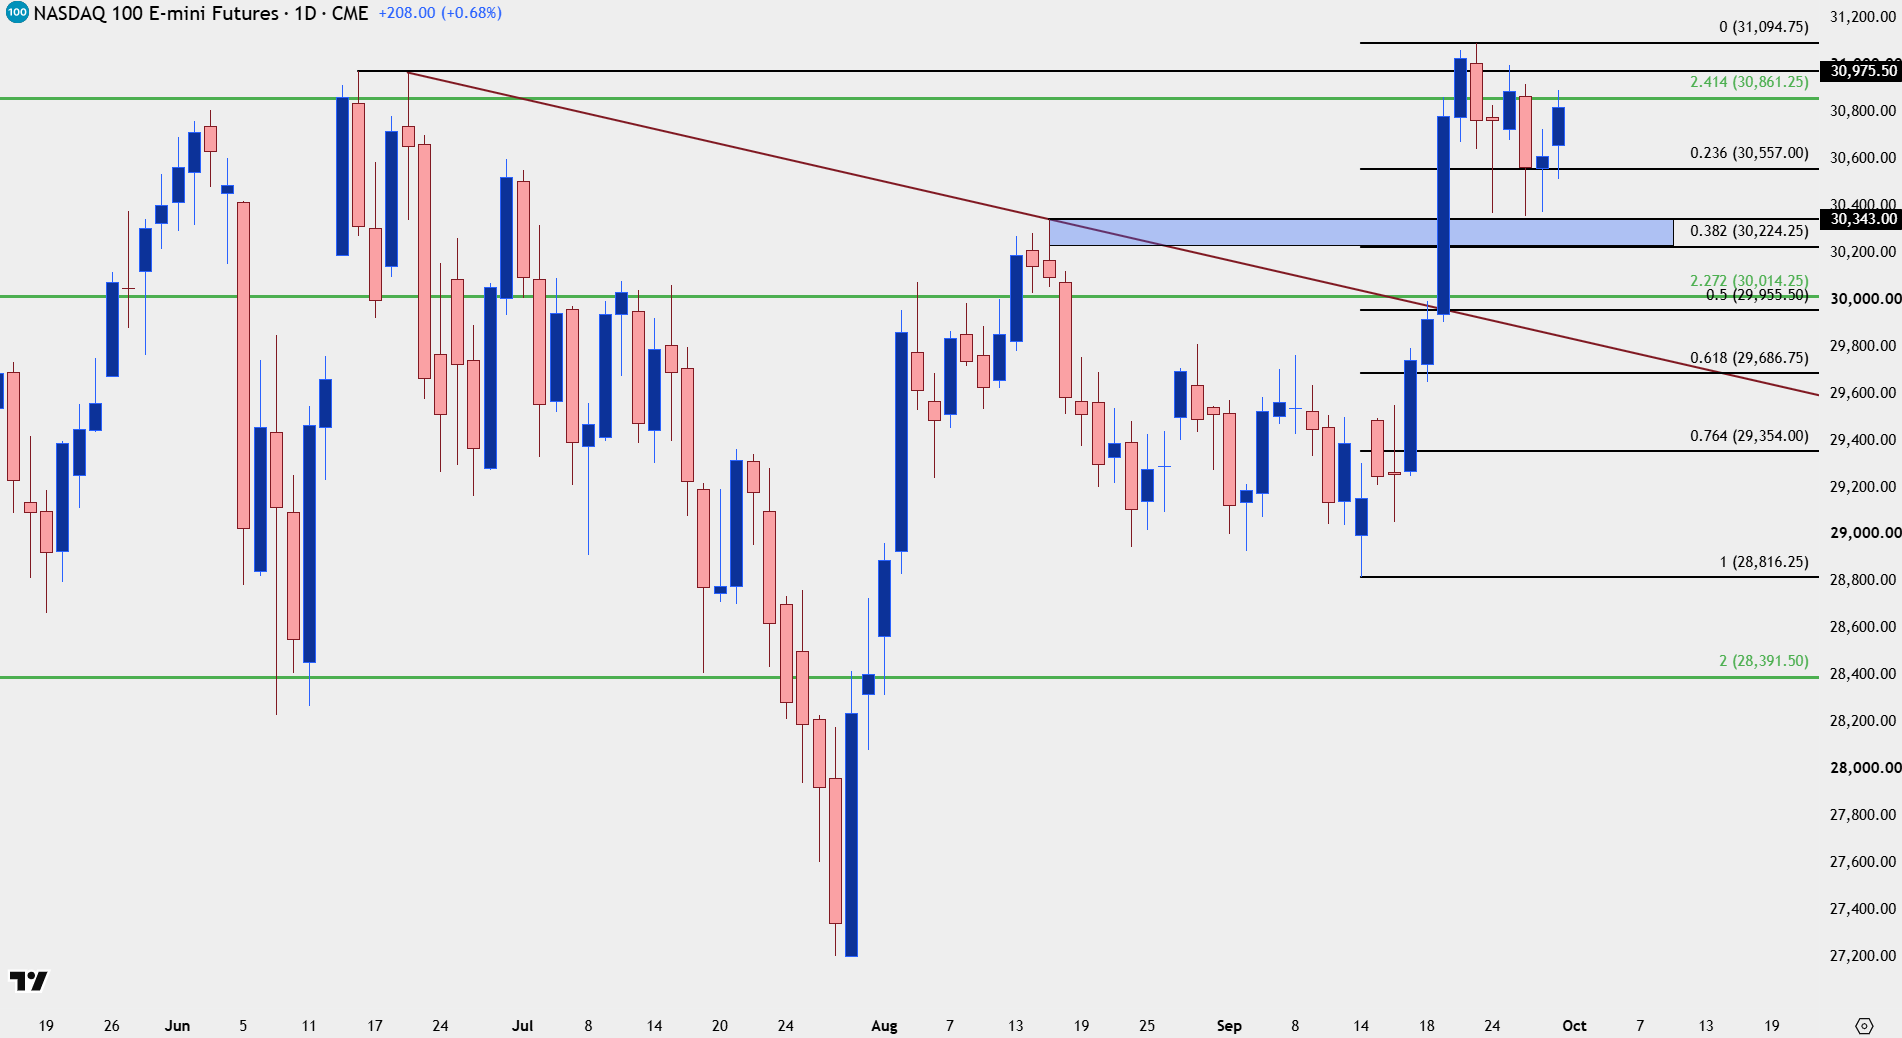
Chart prepared by James Stanley; data derived from Tradingview
Nasdaq Bigger Picture Inverse Head and Shoulders Formation
I looked into this coming into this week, highlighting the fact that the index had recovered into another bullish breakout formation, this time, an inverse head and shoulders pattern. Such formations come with projected moves and those are usually calculated based on the distance from the bottom of the head up to the neckline, and in this case, it points to the possibility of a breakout into a rally to just under the 35k level.
I highlighted this in this week’s 5 Charts for the Week Ahead Video
This content was created by an affiliate of FOREX.com and represents the views and opinions of the author/speakers, not the views and opinions of Forex.com, StoneX Group Inc., or its subsidiaries. The content has not been independently reviewed by FOREX.com.
Granted, it may seem outlandish at this point as that is a little more than 12.6% above current prices. But consider the fact that there’s been so many bearish items and as we go into Q4, a bit of relief in either oil prices or Iran or Treasury rates could serve as catalyst for a breakout.
Nasdaq 100 Weekly Chart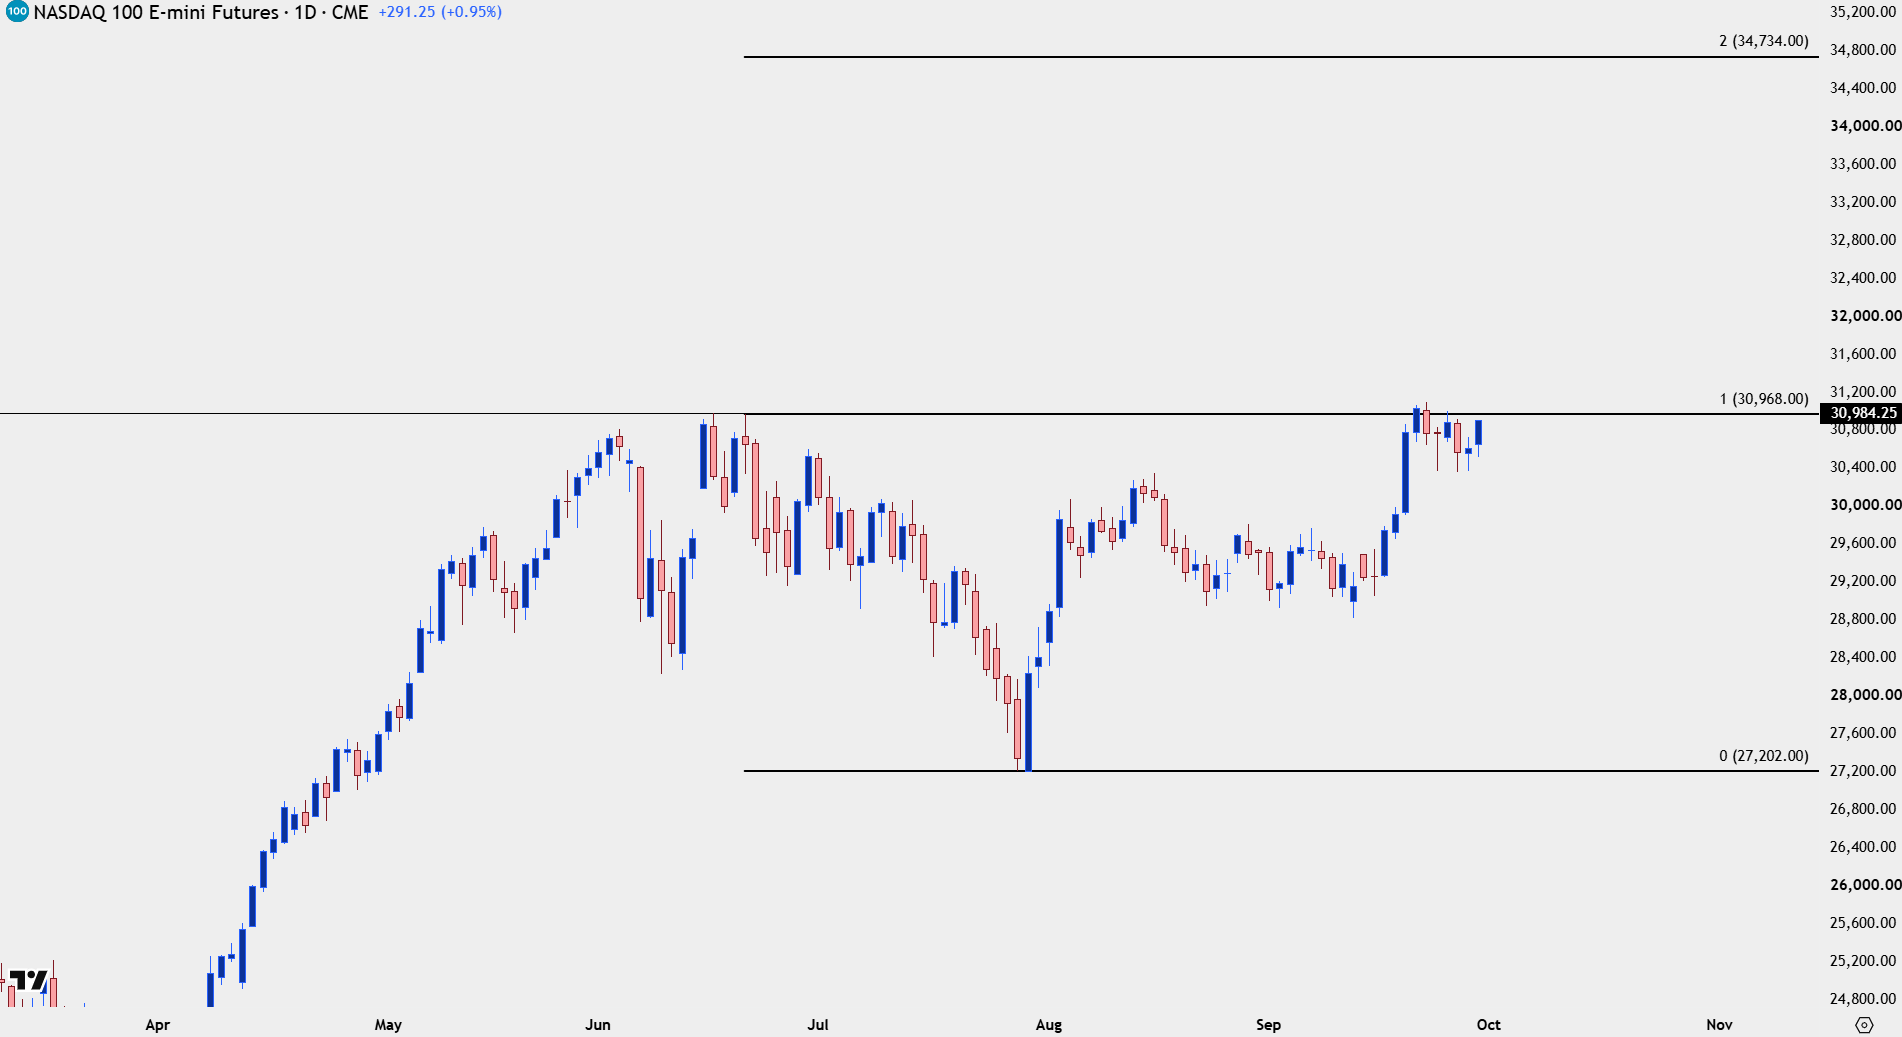
Chart prepared by James Stanley; data derived from Tradingview
Shorter-Term Structure
At this point there’s a few different spots of interest for higher-low supports along with a pretty clear line-in-the-sand for invalidation, taken from a level that’s so far held three different tests. That price is at 30,370 and if sellers are able to break through that, then something has shifted.
But for bulls working pullbacks, ideally, buyers would show up to provide higher-low support at either the 30,722 zone or the 30,557 area, both of which have some prior reference with support/resistance swings.
Nasdaq 100 Two-Hour Chart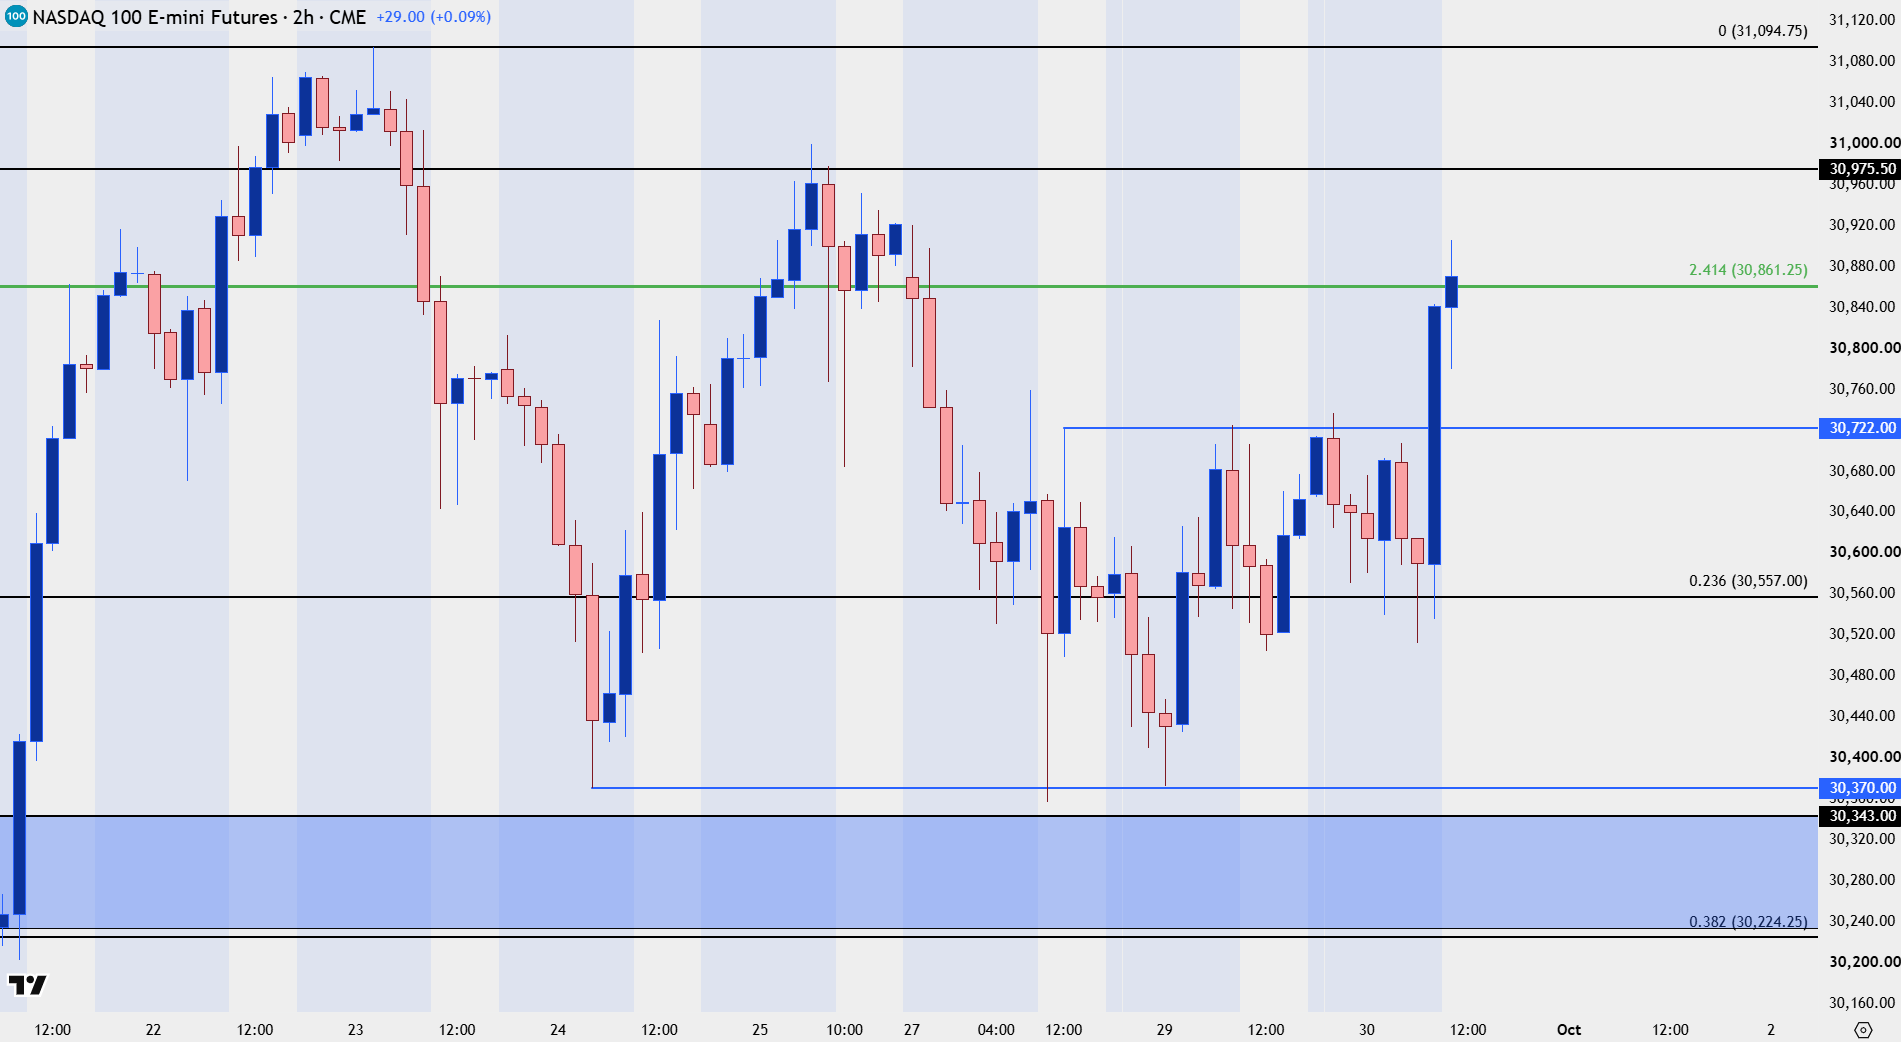
Chart prepared by James Stanley; data derived from Tradingview
--- written by James Stanley, Senior Market Analyst, Global Macro
Related tags:
Latest market news




Open an account in minutes
Experience award-winning platforms with fast and secure execution, and enjoy tight spreads from 0.5 pts on FX and 0.3 pts on indices.
Economic calendar
Web Trader platform
Our sophisticated web-based platform is packed with features.
Related articles
Nasdaq Breakout Potential into Q4 for Melt Up Scenarios
The headlines seem negative in almost any place that you look, with surging Treasury yields and frothy AI valuations getting more and more attention. But, if it’s so bad, why hasn’t the Nasdaq melted down yet, even as the Fed has started hiking rates?

Japanese Yen Technical Analysis: USD/JPY Support Test into Core PCE
USD/JPY has been a battlefield for the past two months as the force of intervention and the threat of more have given sellers an advantage, even as buyers have continued to bid support on pullbacks. This sets the stage for a massive finish to the week with Core PCE and Non-farm Payrolls.

Euro Forecast: EUR/USD Tumbles Towards Yearly Low as Daily RSI Goes Oversold
EUR/USD has been hit hard in the final month of the quarter as USD strength has shown up in a big way. With the pair set to challenge its yearly low as RSI has pushed into oversold territory, is there a chance for a pullback with some big headline risk hitting in the US over the next few days?
This report is intended for general circulation only. It should not be construed as a recommendation, or an offer (or solicitation of an offer) to buy or sell any financial products. The information provided does not take into account your specific investment objectives, financial situation or particular needs. Before you act on any recommendation that may be contained in this report, independent advice ought to be sought from a financial adviser regarding the suitability of the investment product, taking into account your specific investment objectives, financial situation or particular needs.
StoneX Financial Pte. Ltd., may distribute reports produced by its respective foreign entities or affiliates within the StoneX group of companies or third parties pursuant to an arrangement under Regulation 32C of the Financial Advisers Regulations. Where the report is distributed to a person in Singapore who is not an accredited investor, expert investor or an institutional investor (as defined in the Securities Futures Act), StoneX Financial Pte. Ltd. accepts legal responsibility to such persons for the contents of the report only to the extent required by law. Singapore recipients should contact StoneX Financial Pte. Ltd. at 6826 9988 for matters arising from, or in connection with the report.
In the case of all other recipients of this report, to the extent permitted by applicable laws and regulations neither StoneX Financial Pte. Ltd. nor its associated companies will be responsible or liable for any loss or damage incurred arising out of, or in connection with, any use of the information contained in this report and all such liability is hereby expressly disclaimed. No representation or warranty is made, express or implied, that the content of this report is complete or accurate.
StoneX Financial Pte. Ltd. is not under any obligation to update this report.
Trading CFDs carries a high level of risk that may not be suitable for some investors. Consider your investment objectives, level of experience, financial resources, risk appetite and other relevant circumstances carefully. The possibility exists that you could lose some or all of your investments, including your initial deposits. If in doubt, please seek independent expert advice. Visit www.forex.com/en-sg/terms-and-policies for the complete Risk Disclosure Statement.