



Gold, Silver looking toppy after explosive run higher
The rally in gold and silver has been relentless, but with both looking stretched and struggling at key levels, traders may start eyeing downside instead of chasing strength.
Share this:

- Peace looks priced, just as metals start to wobble
- Gold stalls above $4860, silver at $80
- Momentum stretched after a relentless rally
- If these levels hold, pullback risk starts to build
Has the war unwind gone too far?
Markets have spent weeks moving towards pricing an end to the Iran war, especially across riskier asset classes which have effectively retraced the entire initial drawdown as if the event never took place. Looking at price action over the past six months, and particularly since the war began, gold and silver are now trading more like assets at the extreme outer reaches of the risk spectrum rather than anything resembling a haven.
They are moving almost always in line with high beta stocks and currencies, something reinforced again this week as both metals pushed to fresh multi-month highs. However, after a pair of failed breakout attempts on the H4 timeframe, and with other markets that ran hard in anticipation of a ceasefire now looking a tad toppy after a breakneck surge higher over the past fortnight, some form of mean reversion may be in order.
For one, the war hasn’t finished, even though both sides are now talking. And even if time is called on the conflict, it doesn’t mean the after effects will suddenly dissipate to nothing. Higher energy prices are still making their way through supply chains to consumers, meaning the inflation pulse may make it difficult for central banks to deliver additional support to boost activity if needed. A risk premium is also likely to remain embedded in energy prices given how easily shipping through Hormuz was disrupted through threats and drones.
On top of that, China is starting to make noise, threatening a tariff war with the US if it’s hit with fresh levies tied to what it describes as fabricated reports of supplying military equipment to Iran during the conflict.
While price and momentum favour upside right now, both metals look vulnerable if conditions were to abruptly shift.
Gold stalls at familiar level
Source: TradingView
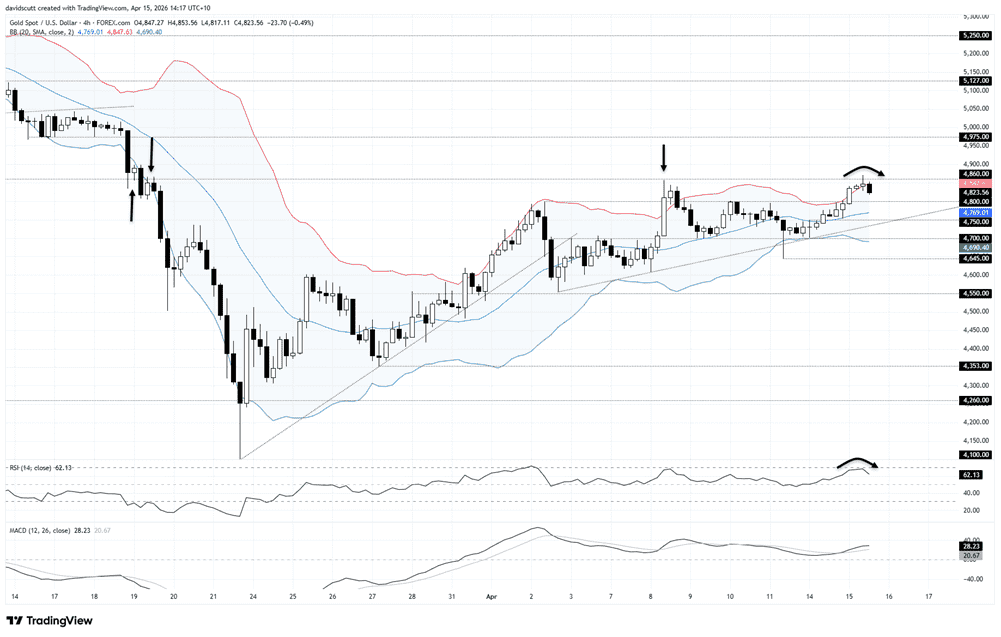
Gold was looking stretched on the H4 earlier in the session, with RSI (14) moving into overbought territory while the price pushed above the upper Bollinger Band following a breakout attempt above $4,860, an important level that has acted as support and resistance on multiple occasions going back to mid-February. But as the chart shows, after surging more than $200 in less than three days, the breakout attempt fizzled, delivering something closer to a doji than an outright shooting star.
The follow-up candle suggests the weak price action hasn’t gone unnoticed, with the price pulling back towards support at $4,800. With resistance overhead at $4,860, traders have an initial range to work with, allowing for setup construction depending on which side is tested first.
A bounce from $4,800 would allow for longs to be set with a tight stop below, targeting $4,860. But if the price were to push beneath $4,800, as recent price action warns of, shorts could be placed with a stop above the level, targeting the 50-period moving average or $4,750 initially, with the April uptrend, $4,700 and $4,645 other options after that.
If the price were to recover towards $4,860, a failure to reclaim the level would allow for shorts to be established with a stop above the session highs for protection, targeting $4,800. A sustained break above $4,860 that sees the session highs overcome would signal a resumption of the broader bullish move, targeting former support at $4,975 initially.
Silver stretched after sharp run
Source: TradingView
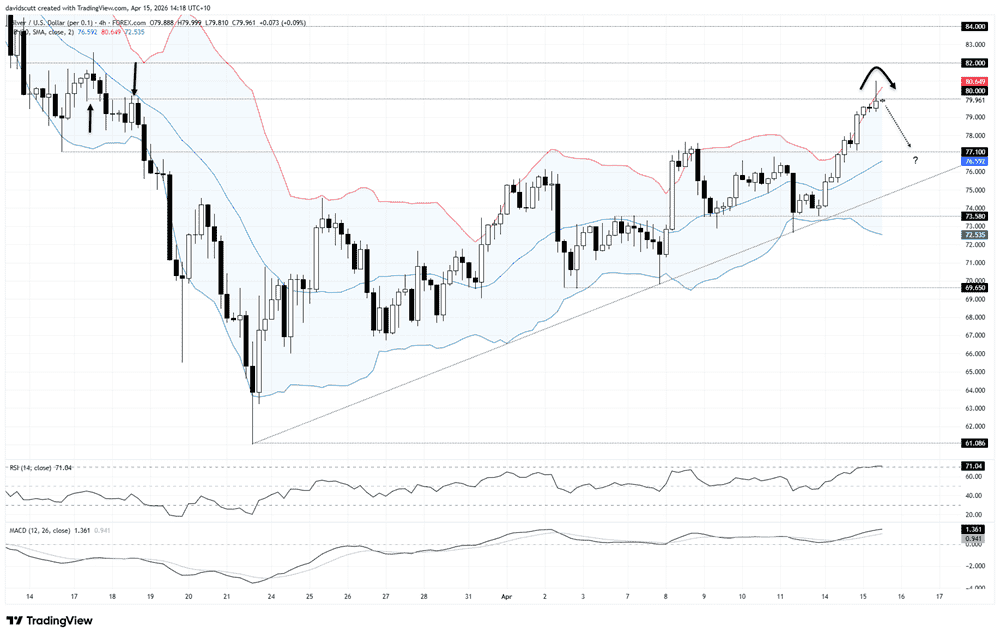
Silver is starting to look stretched on the H4 after surging more than $6 in a little over two days, with RSI (14) now in overbought territory and the price trading above the upper Bollinger Band earlier in the session. The latest candle shows a long topside wick and small body, resembling a shooting star, coming after a failed bullish breakout attempt above $80.
It’s not a slam dunk case for a short, but if the price can’t reclaim $80 and push back towards the session highs, it may encourage profit taking and the initiation of fresh shorts. If the price continues to struggle at $80, shorts could be set beneath the level with a stop above, targeting $77.10 which has acted as support and resistance in the recent past.
Keep an eye on the price action around $78 should the trade start to work, given the tendency for silver to gravitate towards big figures on occasion. If the target is achieved, price action at the 50-period moving average may be instructive on whether to cut, hold or add, given how respectful the price has been of it over recent months, as demonstrated on the chart.

Open an account in minutes
Experience award-winning platforms with fast and secure execution, and enjoy tight spreads from 0.5 pts on FX and 0.3 pts on indices.
Economic calendar
Web Trader platform
Our sophisticated web-based platform is packed with features.
Related articles

USD/JPY outlook: Hawkish Fed recalibration pressures the yen
Stronger US growth momentum and rising Treasury yields are keeping USD/JPY pointed higher, even as Japanese policymakers try to limit the pressure building across domestic markets.

Gold, silver slammed as hawkish Fed repricing reignites dollar upside
Gold and silver had held up surprisingly well against surging US yields. Wednesday’s DXY breakout may have changed that equation.

Euro Short-term Outlook: EUR/USD Selloff Nears Critical Yearly Support 9 23 2026
Euro has fallen seven of the past nine sessions, with stretched momentum raising the stakes as EUR/USD closes in on a major inflection zone.

This report is intended for general circulation only. It should not be construed as a recommendation, or an offer (or solicitation of an offer) to buy or sell any financial products. The information provided does not take into account your specific investment objectives, financial situation or particular needs. Before you act on any recommendation that may be contained in this report, independent advice ought to be sought from a financial adviser regarding the suitability of the investment product, taking into account your specific investment objectives, financial situation or particular needs.
StoneX Financial Pte. Ltd., may distribute reports produced by its respective foreign entities or affiliates within the StoneX group of companies or third parties pursuant to an arrangement under Regulation 32C of the Financial Advisers Regulations. Where the report is distributed to a person in Singapore who is not an accredited investor, expert investor or an institutional investor (as defined in the Securities Futures Act), StoneX Financial Pte. Ltd. accepts legal responsibility to such persons for the contents of the report only to the extent required by law. Singapore recipients should contact StoneX Financial Pte. Ltd. at 6826 9988 for matters arising from, or in connection with the report.
In the case of all other recipients of this report, to the extent permitted by applicable laws and regulations neither StoneX Financial Pte. Ltd. nor its associated companies will be responsible or liable for any loss or damage incurred arising out of, or in connection with, any use of the information contained in this report and all such liability is hereby expressly disclaimed. No representation or warranty is made, express or implied, that the content of this report is complete or accurate.
StoneX Financial Pte. Ltd. is not under any obligation to update this report.
Trading CFDs carries a high level of risk that may not be suitable for some investors. Consider your investment objectives, level of experience, financial resources, risk appetite and other relevant circumstances carefully. The possibility exists that you could lose some or all of your investments, including your initial deposits. If in doubt, please seek independent expert advice. Visit www.forex.com/en-sg/terms-and-policies for the complete Risk Disclosure Statement.