



Gold, USD/JPY Forecast: Two trades to watch
Gold Declines 12% in June. Is There More Weakness to Come? USD/JPY on Intervention Watch.
Share this:



Gold Declines 12% in June. Is There More Weakness to Come?
Gold has recovered back above 4,000 but remains on track to post a 12% decline in June, marking its largest monthly fall since October 2008, as markets shift their focus away from geopolitical risk and back towards higher U.S. interest rates.
The precious metal is also on course for its first quarterly decline since 2024 and its largest three-month fall since the second quarter of 2013.
The decline comes as investors increasingly expect the Federal Reserve to raise interest rates this year.
Following the hawkish FOMC meeting this month and sticky Core PCE inflation at 3.4%, a three-year high, markets are pricing more than a 60% probability of a 25-basis-point rate hike in September and continue to see scope for up to three rate hikes this year.
Those expectations have also lifted the U.S. dollar to a 13-month high. At the same time, higher real yields have increased the opportunity cost of holding non-yielding assets such as gold.
This combination of a hawkish Fed, higher real yields and a stronger U.S. dollar continues to weigh on the precious metal.
Attention now turns to Federal Reserve Chair Kevin Walsh's speech at the ECB Sintra Forum on Wednesday and Thursday's U.S. non-farm payroll report, both of which could provide further clues on the outlook for interest rates and, in turn, gold.
For the outlook to improve, bulls would need to see lower real yields, a softer U.S. dollar or an unwinding of hawkish Fed expectations—none of which appear imminent based on current fundamentals.
Gold Forecast – Technical Analysis
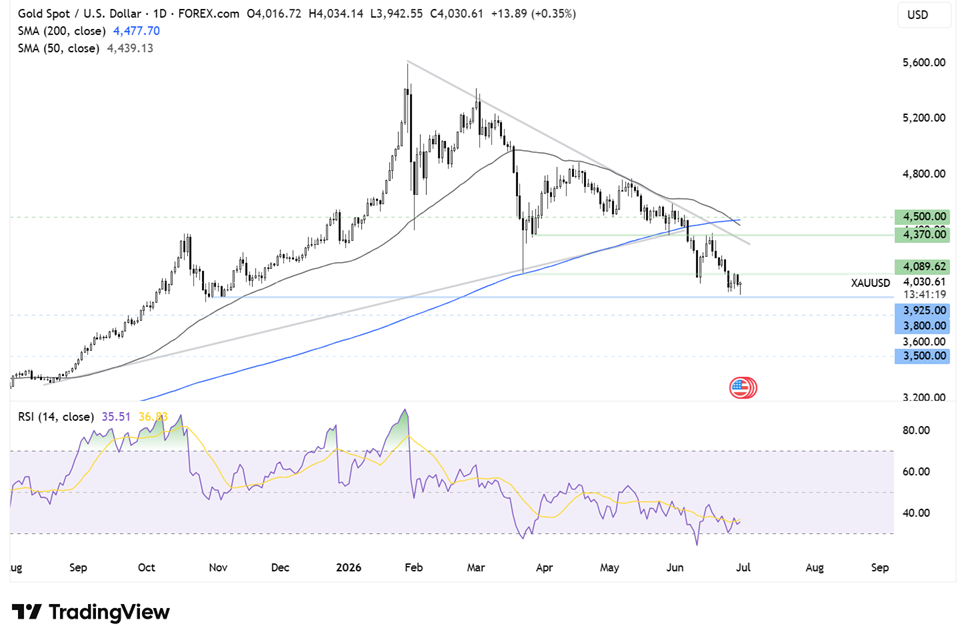
Gold has broken below its symmetrical triangle pattern and the 200-day SMA, falling to a low of 3,942, its weakest level since November.
The 50-day SMA has also crossed below the 200-day SMA, forming a bearish death cross. Combined with the RSI below 50, the technical picture continues to favour further downside.
Sellers will look to extend losses towards 3,930, the November low, followed by 3,800. A break below there could expose the psychological 3,500 level.
Any recovery would first need to reclaim 4,100, which marks this week's high and the March low. Above there, attention turns to falling trendline resistance around 4,300, followed by horizontal resistance at 4,350. A move above that level would expose the 200-day SMA around 4,500.
USD/JPY on Intervention Watch
USD/JPY has risen to a 40-year high above 162, raising concerns that Japanese authorities could intervene to support the yen.
The yen has fallen to levels not seen since 1986, fuelling speculation that Tokyo could step into the market in the coming days, even as the U.S. dollar has eased back from its 13-month high.
The yen fell 2% in the second quarter, marking its fourth straight quarterly decline and its longest losing streak in four years as the wide U.S.-Japan interest rate differential continues to weigh on the Japanese currency.
Japanese Finance Minister Satsuki Katayama reiterated that authorities stand ready to respond appropriately at any time. Previous interventions have tended to occur during periods of thinner market liquidity, and with this being a holiday-shortened week, market conditions could favour such a move.
The question increasingly appears to be when, rather than if, the Ministry of Finance intervenes again. However, unless intervention is accompanied by a narrowing in the U.S.-Japan interest rate differential, history suggests any support for the yen is likely to prove temporary.
Japan intervened in late February and again in early May, briefly supporting the yen before USD/JPY resumed its climb as markets repriced the outlook for U.S. interest rates. The market has repeatedly faded intervention because the underlying macro drivers remain unchanged. As long as U.S. yields continue to outpace Japanese yields, the carry trade is likely to continue supporting USD/JPY.
Following the hawkish Fed meeting this month and sticky Core PCE inflation at 3.4%, a three-year high, markets are pricing around a 60% probability of a 25-basis-point rate hike in September and continue to see scope for up to three hikes this year.
Attention this week will be on Federal Reserve Chair Kevin Walsh's speech at the ECB Sintra Forum on Wednesday and Thursday's U.S. non-farm payroll report, both of which could provide further clues on the outlook for U.S. interest rates.
Ahead of that, U.S. consumer confidence and JOLTS job openings data will also be closely watched.
USD/JPY Forecast – Technical Analysis
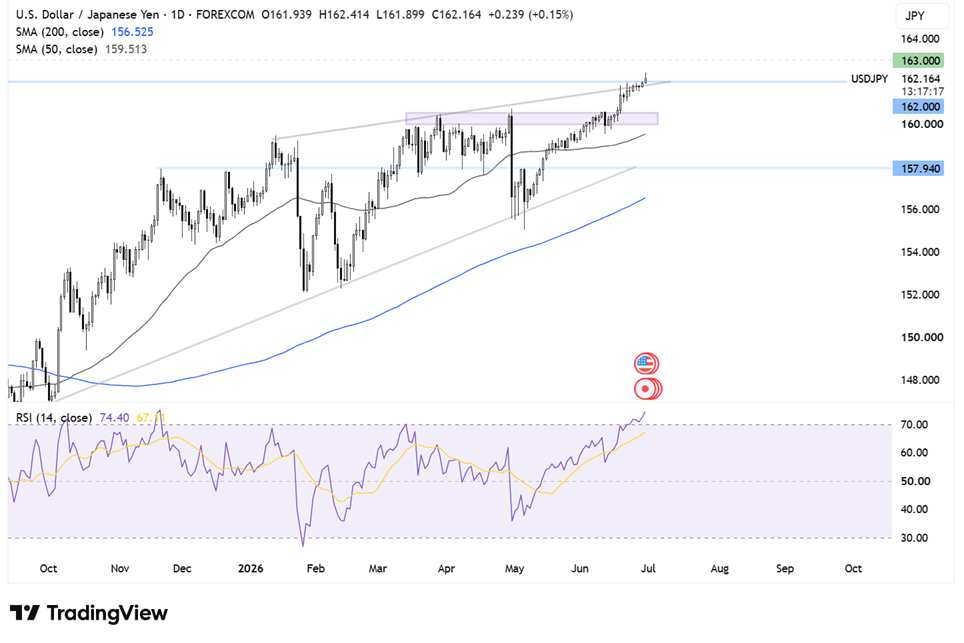
USD/JPY has broken above the upper boundary of its rising wedge pattern, pushing to a fresh 40-year high of 162.40 and invalidating the previous reversal setup.
The RSI is in overbought territory across multiple timeframes, suggesting the pair could consolidate before attempting another move higher.
Buyers will look to extend gains towards 165, with 170 the next longer-term upside target.
Immediate support is seen at 160.20, followed by the key 160.00 support zone. A break below here exposes the 50-day SMA around 159.50, ahead of 157.90, where the rising trendline converges with horizontal support.
Related tags:


Open an account in minutes
Experience award-winning platforms with fast and secure execution, and enjoy tight spreads from 0.5 pts on FX and 0.3 pts on indices.
Economic calendar
Web Trader platform
Our sophisticated web-based platform is packed with features.
Related articles

USD/JPY outlook: Hawkish Fed recalibration pressures the yen
Stronger US growth momentum and rising Treasury yields are keeping USD/JPY pointed higher, even as Japanese policymakers try to limit the pressure building across domestic markets.


Gold, silver slammed as hawkish Fed repricing reignites dollar upside
Gold and silver had held up surprisingly well against surging US yields. Wednesday’s DXY breakout may have changed that equation.

USD/JPY Bulls Continue to Push as Markets ‘Bet Against the House’
USD/JPY is now up by more than 500 pips from the low taken the day that Scott Bessent taunted markets, saying ‘you can bet against me if you want.’

This report is intended for general circulation only. It should not be construed as a recommendation, or an offer (or solicitation of an offer) to buy or sell any financial products. The information provided does not take into account your specific investment objectives, financial situation or particular needs. Before you act on any recommendation that may be contained in this report, independent advice ought to be sought from a financial adviser regarding the suitability of the investment product, taking into account your specific investment objectives, financial situation or particular needs.
StoneX Financial Pte. Ltd., may distribute reports produced by its respective foreign entities or affiliates within the StoneX group of companies or third parties pursuant to an arrangement under Regulation 32C of the Financial Advisers Regulations. Where the report is distributed to a person in Singapore who is not an accredited investor, expert investor or an institutional investor (as defined in the Securities Futures Act), StoneX Financial Pte. Ltd. accepts legal responsibility to such persons for the contents of the report only to the extent required by law. Singapore recipients should contact StoneX Financial Pte. Ltd. at 6826 9988 for matters arising from, or in connection with the report.
In the case of all other recipients of this report, to the extent permitted by applicable laws and regulations neither StoneX Financial Pte. Ltd. nor its associated companies will be responsible or liable for any loss or damage incurred arising out of, or in connection with, any use of the information contained in this report and all such liability is hereby expressly disclaimed. No representation or warranty is made, express or implied, that the content of this report is complete or accurate.
StoneX Financial Pte. Ltd. is not under any obligation to update this report.
Trading CFDs carries a high level of risk that may not be suitable for some investors. Consider your investment objectives, level of experience, financial resources, risk appetite and other relevant circumstances carefully. The possibility exists that you could lose some or all of your investments, including your initial deposits. If in doubt, please seek independent expert advice. Visit www.forex.com/en-sg/terms-and-policies for the complete Risk Disclosure Statement.