



Hang Seng Tech Index: Bulls pause with Alibaba, Nvidia in focus
The Hang Seng Tech Index has lost momentum after leading the China rally this year, with Alibaba and Nvidia earnings set to provide the next big test for directional risk.
Share this:

Summary
The Hang Seng Tech Index has stalled having led the China equity rally throughout this year, showing rare signs of caution ahead of a busy period for earnings. Alibaba reports Thursday with the focus again on its AI strategy, though like Tencent and Baidu, big investments have yet to deliver with revenues squeezed by weak consumer uptake and fierce price competition. With Nvidia earnings due after the bell on Wednesday, how the index trades around these key updates may provide a guide on directional risks for the broader Hang Seng and other Chinese markets heading into September.
Hang Seng Tech Rally Pauses as Key Earnings Near
Source: TradingView
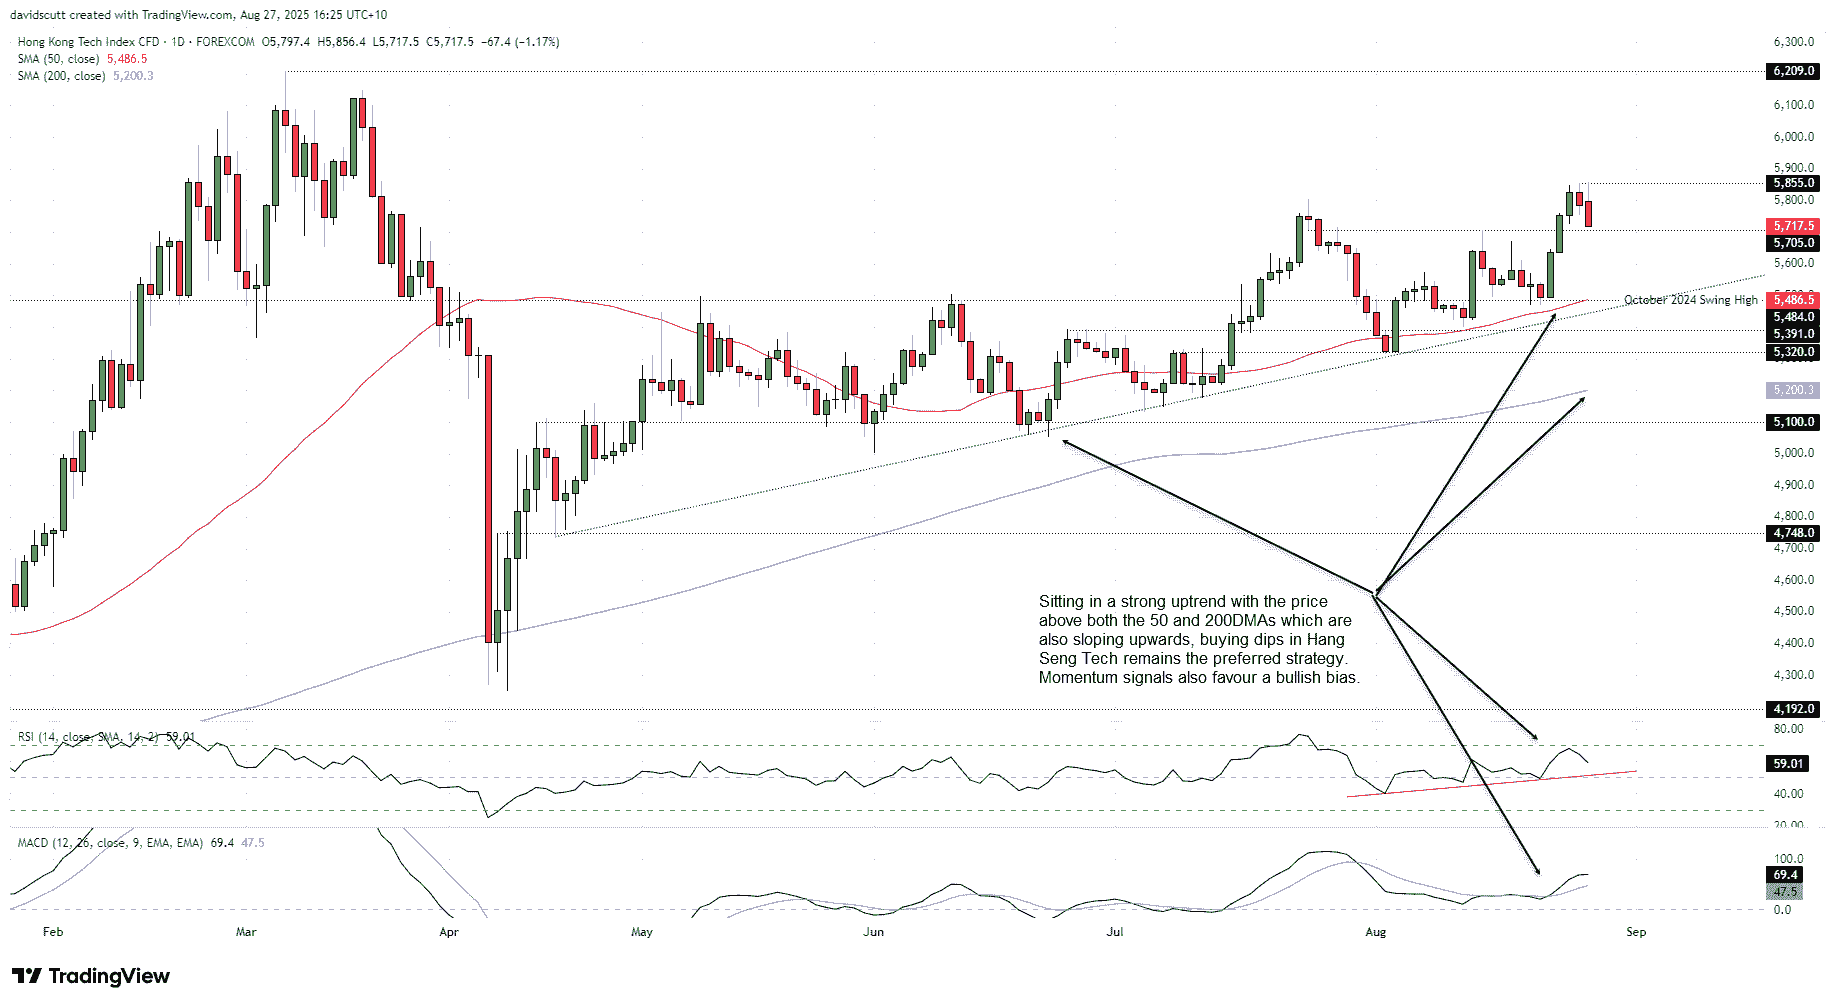
You can see how the sharp rebound in the Hang Seng Tech Index following Jerome Powell’s speech at the Jackson Hole has stalled this week, with the contract struggling to hold above the July 24 swing high, topping out at 5855 before reversing lower. Given the unconvincing price action, it’s worthwhile taking a look at key levels located nearby, allowing traders to assess potential setups before and after this period of major corporate event risk hits.
On the downside, 5705 provided both support and resistance over the past two months, making it the first level of note. Beyond that, the October 2024 swing high of 5484 saw plenty of action earlier in the year. Combined with the uptrend running from the low set on April 16 and 50-day moving average, this support zone that extends down to 5440 could prove difficult to crack without a major risk-off episode. If it were to be broken, 5391, 5320, the 200-day moving average and 5100 are the levels to watch.
On the topside, a clean break above 5855 would put the March swing high of 6209 on the radar for bulls, with only the psychological 6000-point level in between.
Given the index remains in an uptrend and comfortably above the 50 and 200-day moving averages, which are also moving higher, buying dips and bullish breaks remains the preferred strategy. Momentum indicators back this view, with RSI (14) trending higher above 50 while MACD sits in positive territory having already crossed the signal line from below earlier this month. Combined, a bullish directional bias is favoured.
Related tags:



Open an account in minutes
Experience award-winning platforms with fast and secure execution, and enjoy tight spreads from 0.5 pts on FX and 0.3 pts on indices.
Economic calendar
Web Trader platform
Our sophisticated web-based platform is packed with features.
Related articles

Gold, silver slammed as hawkish Fed repricing reignites dollar upside
Gold and silver had held up surprisingly well against surging US yields. Wednesday’s DXY breakout may have changed that equation.

Euro Short-term Outlook: EUR/USD Selloff Nears Critical Yearly Support 9 23 2026
Euro has fallen seven of the past nine sessions, with stretched momentum raising the stakes as EUR/USD closes in on a major inflection zone.


GBP/USD forecast: US dollar surges as bonds implode
The US dollar continued to press higher deep into the European session, supported by the slump in the bond markets as yields broke out across the curve. Following the recent hawkish Fed rate hike, yield spreads between the US and the rest of the world has continually increased, and that motion continued today, helped in part by some forecast-beating US macro data and hawkish Fed commentary.

This report is intended for general circulation only. It should not be construed as a recommendation, or an offer (or solicitation of an offer) to buy or sell any financial products. The information provided does not take into account your specific investment objectives, financial situation or particular needs. Before you act on any recommendation that may be contained in this report, independent advice ought to be sought from a financial adviser regarding the suitability of the investment product, taking into account your specific investment objectives, financial situation or particular needs.
StoneX Financial Pte. Ltd., may distribute reports produced by its respective foreign entities or affiliates within the StoneX group of companies or third parties pursuant to an arrangement under Regulation 32C of the Financial Advisers Regulations. Where the report is distributed to a person in Singapore who is not an accredited investor, expert investor or an institutional investor (as defined in the Securities Futures Act), StoneX Financial Pte. Ltd. accepts legal responsibility to such persons for the contents of the report only to the extent required by law. Singapore recipients should contact StoneX Financial Pte. Ltd. at 6826 9988 for matters arising from, or in connection with the report.
In the case of all other recipients of this report, to the extent permitted by applicable laws and regulations neither StoneX Financial Pte. Ltd. nor its associated companies will be responsible or liable for any loss or damage incurred arising out of, or in connection with, any use of the information contained in this report and all such liability is hereby expressly disclaimed. No representation or warranty is made, express or implied, that the content of this report is complete or accurate.
StoneX Financial Pte. Ltd. is not under any obligation to update this report.
Trading CFDs carries a high level of risk that may not be suitable for some investors. Consider your investment objectives, level of experience, financial resources, risk appetite and other relevant circumstances carefully. The possibility exists that you could lose some or all of your investments, including your initial deposits. If in doubt, please seek independent expert advice. Visit www.forex.com/en-sg/terms-and-policies for the complete Risk Disclosure Statement.