



Is the bear market over or just beginning
A couple of interesting charts in the S&P 500 index and Gold help us tell a story and set us up with a trading plan.
Share this:

Is the bear market over or just beginning?
A couple of interesting charts in the S&P 500 index and Gold help us tell a story and set us up with a trading plan.
The S&P 500 closed up an impressive 10.40% this week which marked the largest weekly gain since 1974, lifted by the Automobiles & Components (+29.11%), Real Estate (+20.3%) and Banks (+20.02%) sectors. The Nasdaq index remains the best performing index in the U.S. year-to-date. The Invesco QQQ Trust ETF is down approximately -5.53 per cent year-to-date compared to a decline of -13.56 per cent for the SPDR S&P 500 index ETF (SPY) and -16.82 per cent for the SPDR Dow Jones Industrial Average ETF (DIA).
Are we witnessing the shortest bear market in history or is the market getting ready to test the lows? No one knows, we have been preparing for a move in either direction. Here are a few charts to consider.
The SPDR S&P 500 (SPY) index ETF has clearly broken its uptrend on a monthly log chart. We are at a tipping point in the index. Can we break back into the uptrend that started in 2009 or is this the beginning of a long term downtrend? For now, price action below trend is a bearish signal.
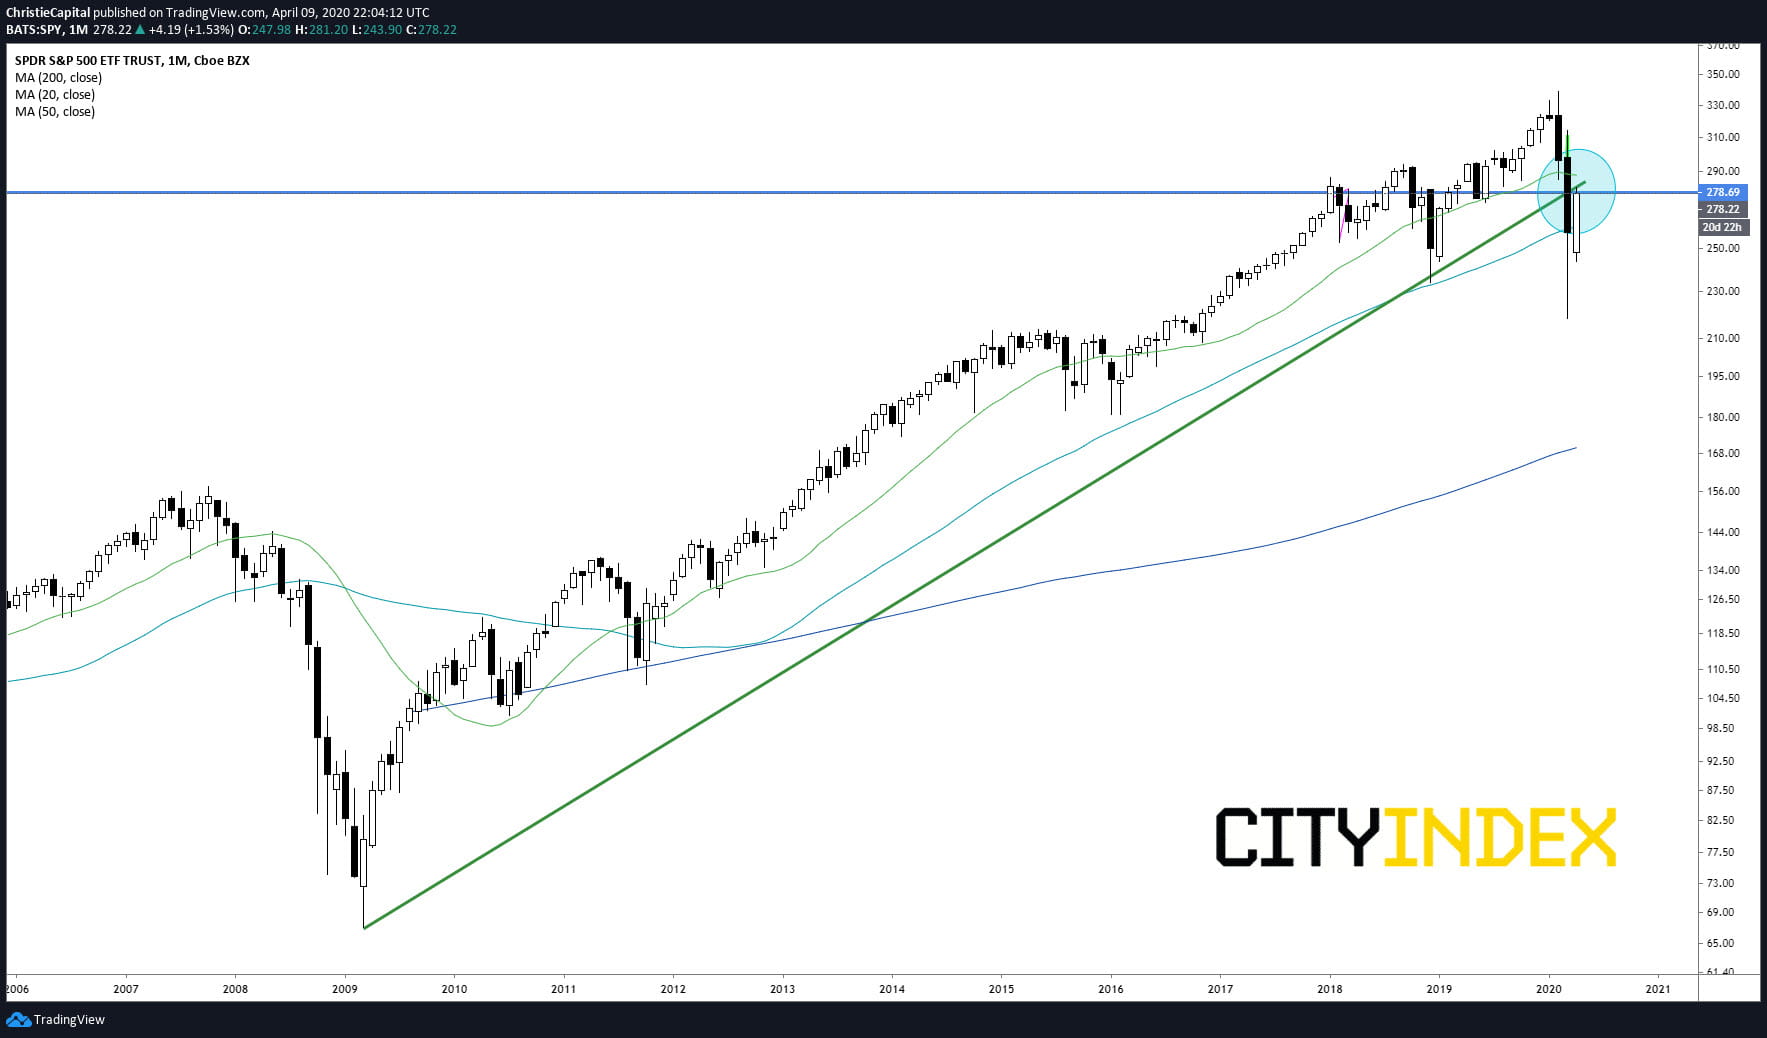
SPY Product not offered by GAIN Capital and is for illustration purposes only - Source: GAIN Capital, TradingView
let's focus in on a daily chart of SPY. The index has retraced 50% of its decline from record highs to March lows. Notice how we posted a spinning top reversal candlestick pattern just below the decade long rising trend line in green. Caution is warranted here. We need to see a strong breakout to the upside next week which would set us up for a bullish strategy towards the 50-day moving average at around the $300 level. A reversal next week would set the market up for a test of April lows near $245 and ultimately the March low at $218.50. Below, a picture speaks a thousand words.
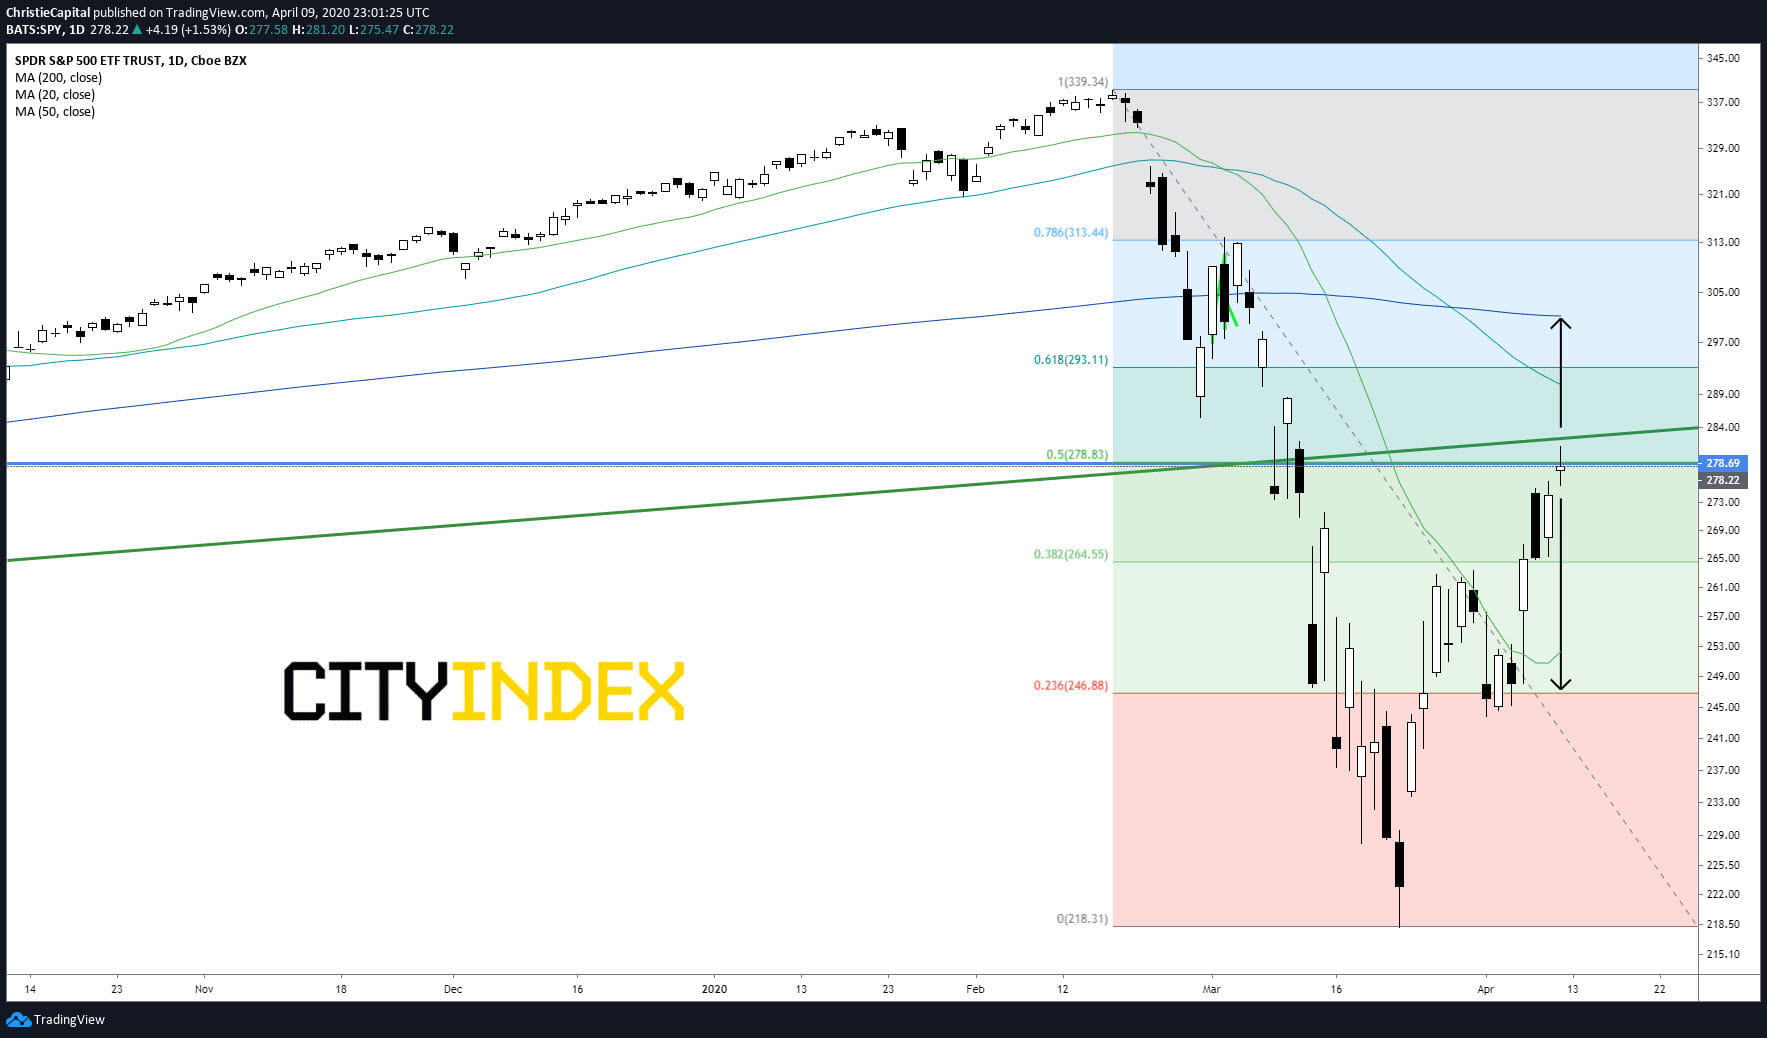
SPY Product not offered by GAIN Capital and is for illustration purposes only - Source: GAIN Capital, TradingView
What about gold?
Worried about the Fed printing money like there is no tomorrow? No one has figured out how to print gold yet...Take a look at a monthly chart of spot gold. Prices have broken above a saucer (rounding bottom) consolidation just like they did back in 2004. A break above record highs at $1910 might signal the rebirth of a multi-year long up trend.
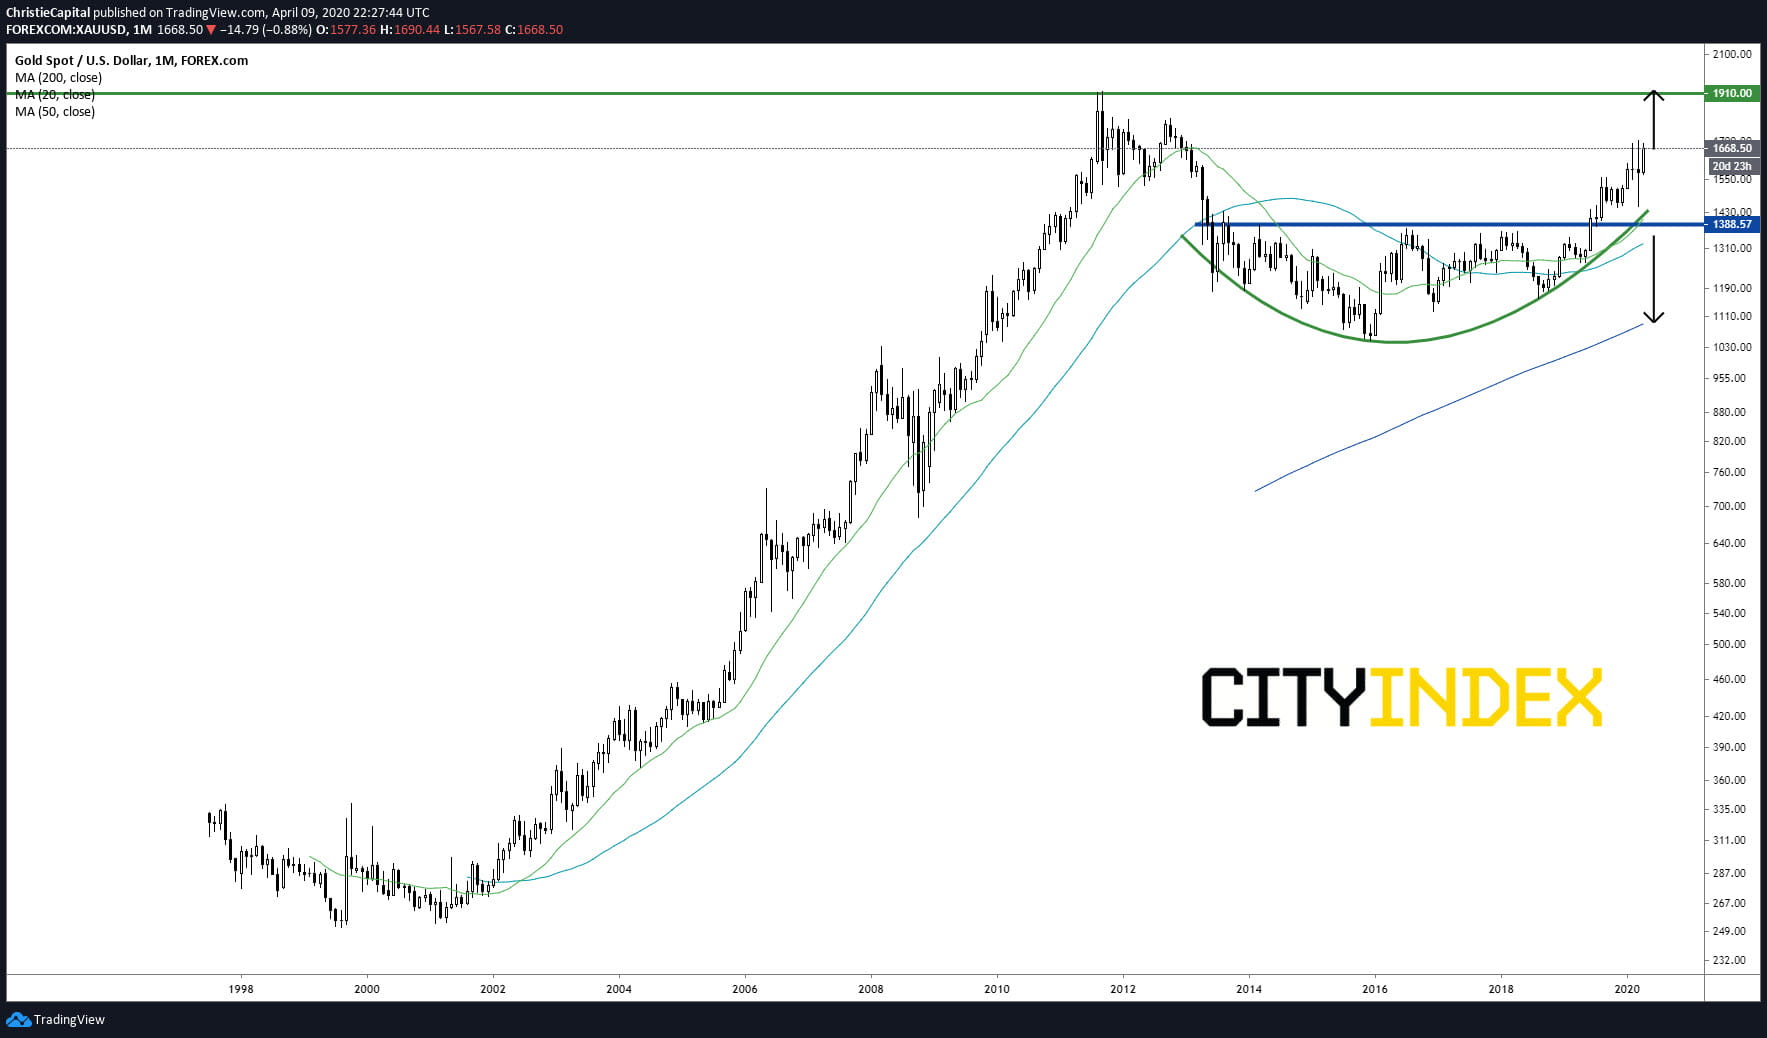
Source: GAIN Capital, TradingView
Have a safe and happy long weekend.
A couple of interesting charts in the S&P 500 index and Gold help us tell a story and set us up with a trading plan.
The S&P 500 closed up an impressive 10.40% this week which marked the largest weekly gain since 1974, lifted by the Automobiles & Components (+29.11%), Real Estate (+20.3%) and Banks (+20.02%) sectors. The Nasdaq index remains the best performing index in the U.S. year-to-date. The Invesco QQQ Trust ETF is down approximately -5.53 per cent year-to-date compared to a decline of -13.56 per cent for the SPDR S&P 500 index ETF (SPY) and -16.82 per cent for the SPDR Dow Jones Industrial Average ETF (DIA).
Are we witnessing the shortest bear market in history or is the market getting ready to test the lows? No one knows, we have been preparing for a move in either direction. Here are a few charts to consider.
The SPDR S&P 500 (SPY) index ETF has clearly broken its uptrend on a monthly log chart. We are at a tipping point in the index. Can we break back into the uptrend that started in 2009 or is this the beginning of a long term downtrend? For now, price action below trend is a bearish signal.
SPY Product not offered by GAIN Capital and is for illustration purposes only - Source: GAIN Capital, TradingView
let's focus in on a daily chart of SPY. The index has retraced 50% of its decline from record highs to March lows. Notice how we posted a spinning top reversal candlestick pattern just below the decade long rising trend line in green. Caution is warranted here. We need to see a strong breakout to the upside next week which would set us up for a bullish strategy towards the 50-day moving average at around the $300 level. A reversal next week would set the market up for a test of April lows near $245 and ultimately the March low at $218.50. Below, a picture speaks a thousand words.
SPY Product not offered by GAIN Capital and is for illustration purposes only - Source: GAIN Capital, TradingView
What about gold?
Worried about the Fed printing money like there is no tomorrow? No one has figured out how to print gold yet...Take a look at a monthly chart of spot gold. Prices have broken above a saucer (rounding bottom) consolidation just like they did back in 2004. A break above record highs at $1910 might signal the rebirth of a multi-year long up trend.
Source: GAIN Capital, TradingView
Have a safe and happy long weekend.
Is the bear market over or just beginning?
A couple of interesting charts in the S&P 500 index and Gold help us tell a story and set us up with a trading plan.
The S&P 500 closed up an impressive 10.40% this week which marked the largest weekly gain since 1974, lifted by the Automobiles & Components (+29.11%), Real Estate (+20.3%) and Banks (+20.02%) sectors. The Nasdaq index remains the best performing index in the U.S. year-to-date. The Invesco QQQ Trust ETF is down approximately -5.53 per cent year-to-date compared to a decline of -13.56 per cent for the SPDR S&P 500 index ETF (SPY) and -16.82 per cent for the SPDR Dow Jones Industrial Average ETF (DIA).
Are we witnessing the shortest bear market in history or is the market getting ready to test the lows? No one knows, we have been preparing for a move in either direction. Here are a few charts to consider.
The SPDR S&P 500 (SPY) index ETF has clearly broken its uptrend on a monthly log chart. We are at a tipping point in the index. Can we break back into the uptrend that started in 2009 or is this the beginning of a long term downtrend? For now, price action below trend is a bearish signal.
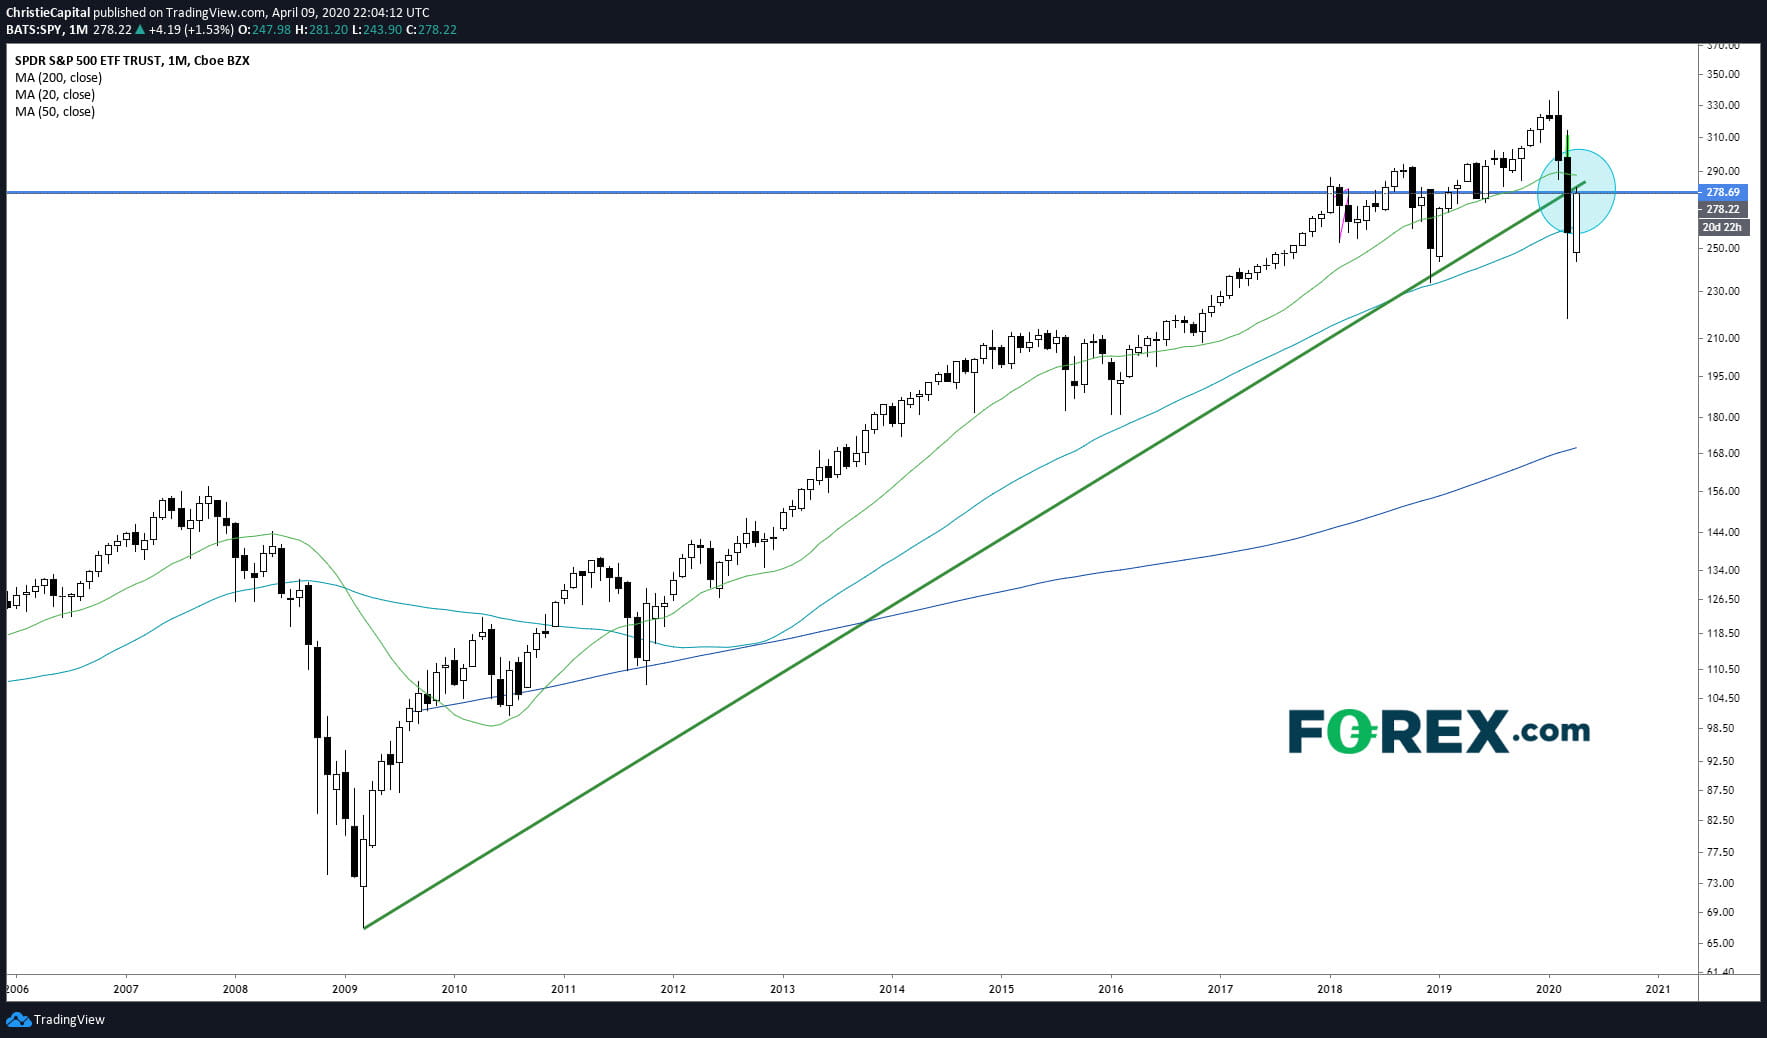
SPY Product not offered by GAIN Capital and is for illustration purposes only - Source: GAIN Capital, TradingView
let's focus in on a daily chart of SPY. The index has retraced 50% of its decline from record highs to March lows. Notice how we posted a spinning top reversal candlestick pattern just below the decade long rising trend line in green. Caution is warranted here. We need to see a strong breakout to the upside next week which would set us up for a bullish strategy towards the 50-day moving average at around the $300 level. A reversal next week would set the market up for a test of April lows near $245 and ultimately the March low at $218.50. Below, a picture speaks a thousand words.
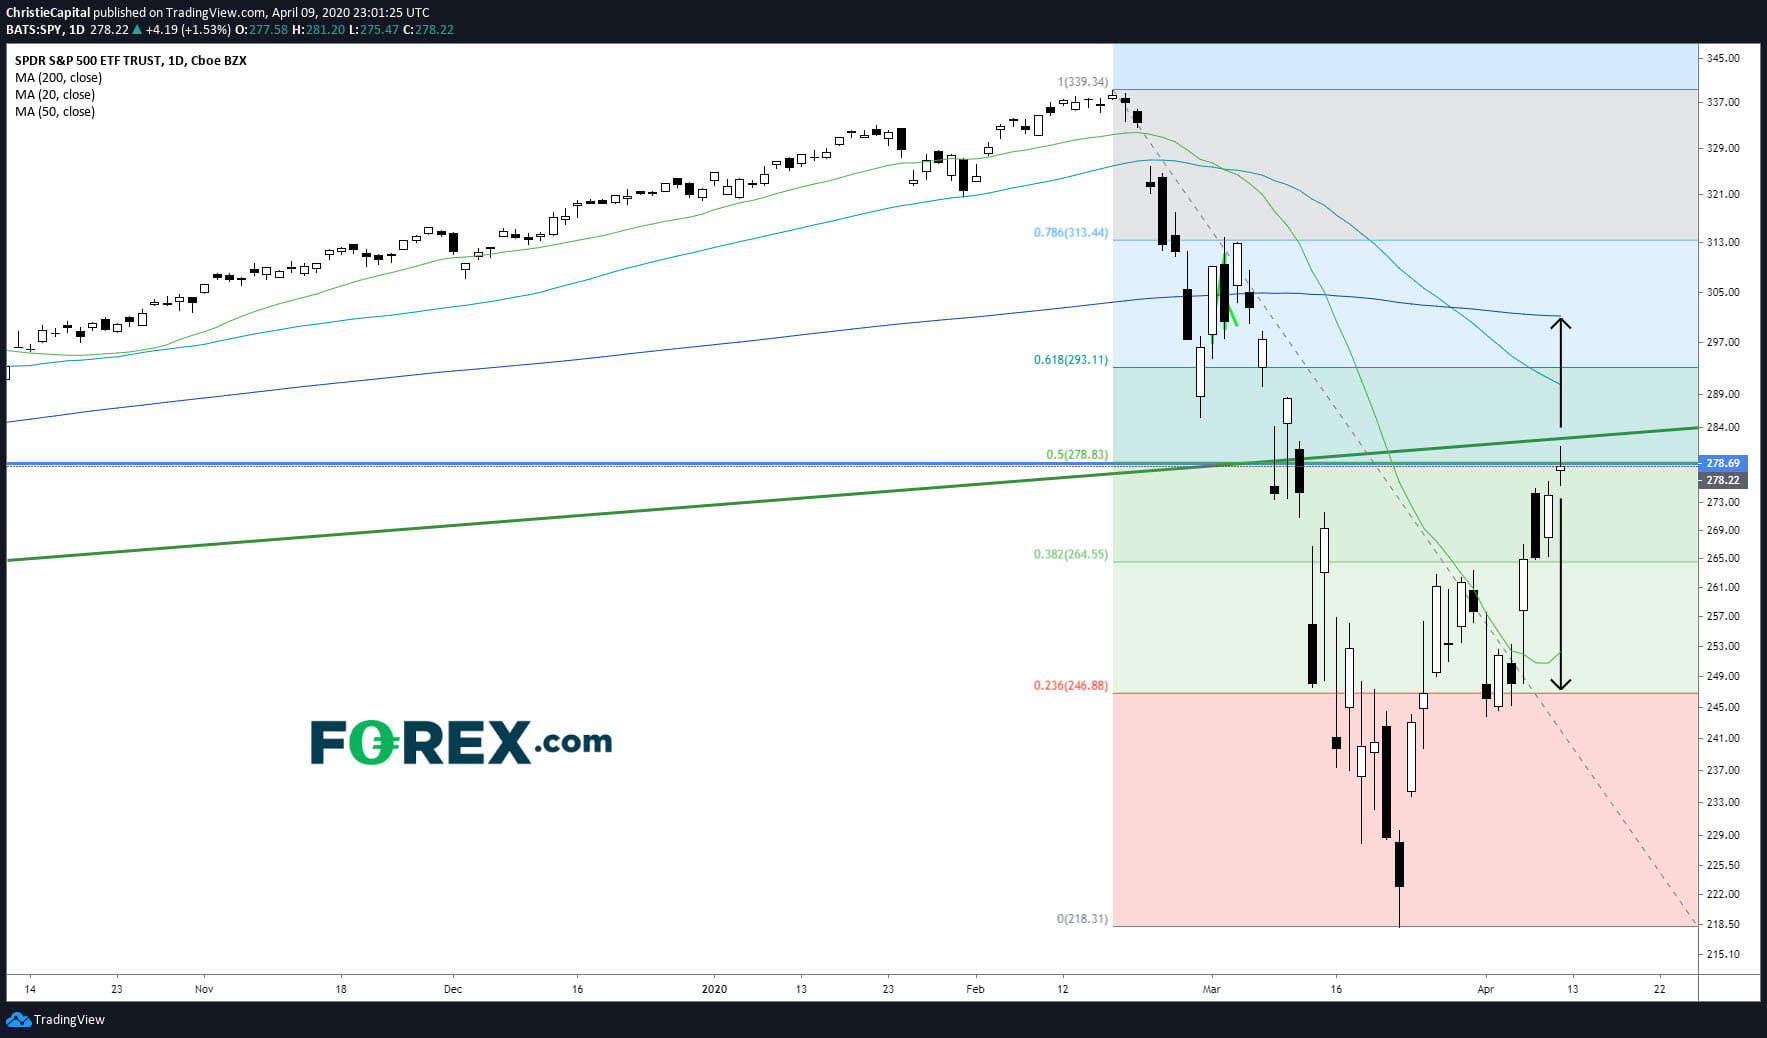
SPY Product not offered by GAIN Capital and is for illustration purposes only - Source: GAIN Capital, TradingView
What about gold?
Worried about the Fed printing money like there is no tomorrow? No one has figured out how to print gold yet...Take a look at a monthly chart of spot gold. Prices have broken above a saucer (rounding bottom) consolidation just like they did back in 2004. A break above record highs at $1910 might signal the rebirth of a multi-year long up trend.
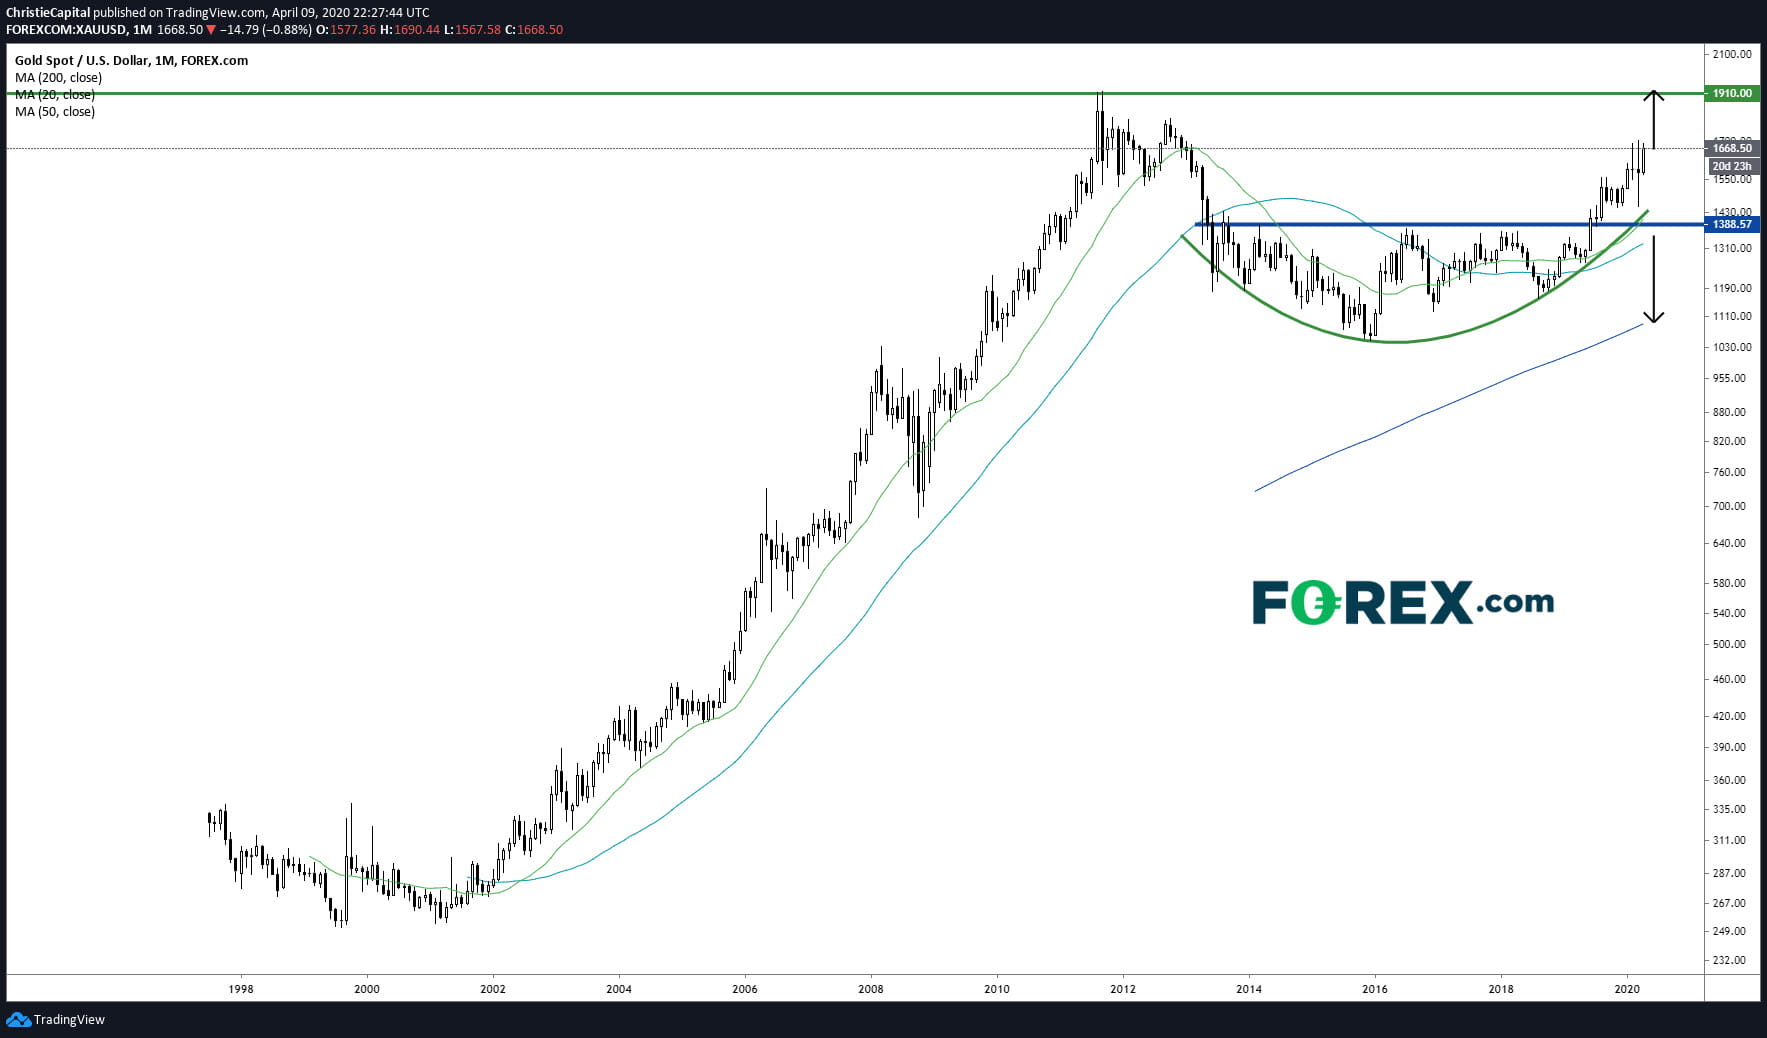
Source: GAIN Capital, TradingView
Have a safe and happy long weekend.
A couple of interesting charts in the S&P 500 index and Gold help us tell a story and set us up with a trading plan.
The S&P 500 closed up an impressive 10.40% this week which marked the largest weekly gain since 1974, lifted by the Automobiles & Components (+29.11%), Real Estate (+20.3%) and Banks (+20.02%) sectors. The Nasdaq index remains the best performing index in the U.S. year-to-date. The Invesco QQQ Trust ETF is down approximately -5.53 per cent year-to-date compared to a decline of -13.56 per cent for the SPDR S&P 500 index ETF (SPY) and -16.82 per cent for the SPDR Dow Jones Industrial Average ETF (DIA).
Are we witnessing the shortest bear market in history or is the market getting ready to test the lows? No one knows, we have been preparing for a move in either direction. Here are a few charts to consider.
The SPDR S&P 500 (SPY) index ETF has clearly broken its uptrend on a monthly log chart. We are at a tipping point in the index. Can we break back into the uptrend that started in 2009 or is this the beginning of a long term downtrend? For now, price action below trend is a bearish signal.
SPY Product not offered by GAIN Capital and is for illustration purposes only - Source: GAIN Capital, TradingView
let's focus in on a daily chart of SPY. The index has retraced 50% of its decline from record highs to March lows. Notice how we posted a spinning top reversal candlestick pattern just below the decade long rising trend line in green. Caution is warranted here. We need to see a strong breakout to the upside next week which would set us up for a bullish strategy towards the 50-day moving average at around the $300 level. A reversal next week would set the market up for a test of April lows near $245 and ultimately the March low at $218.50. Below, a picture speaks a thousand words.
SPY Product not offered by GAIN Capital and is for illustration purposes only - Source: GAIN Capital, TradingView
What about gold?
Worried about the Fed printing money like there is no tomorrow? No one has figured out how to print gold yet...Take a look at a monthly chart of spot gold. Prices have broken above a saucer (rounding bottom) consolidation just like they did back in 2004. A break above record highs at $1910 might signal the rebirth of a multi-year long up trend.
Source: GAIN Capital, TradingView
Have a safe and happy long weekend.



Open an account in minutes
Experience award-winning platforms with fast and secure execution, and enjoy tight spreads from 0.5 pts on FX and 0.3 pts on indices.
Economic calendar
Web Trader platform
Our sophisticated web-based platform is packed with features.
Related articles

Gold Analysis: Rising Yields and Dollar Strength Weigh on XAU/USD
The trading week continues, and for now gold remains under notable pressure in the short term. This can be seen in the performance of XAU/USD over the last three trading sessions, where the metal has declined by more than 2.00%, bringing a bearish bias back into focus after it had lost momentum in recent weeks.

EUR/USD, Gold Forecast: Two trades to watch
EUR/USD falls to a 2-month low despite Eurozone growth picking up. Gold under pressure as a stronger USD offsets falling oil prices.


ASX 200 Rebound Stalls Despite Wall Street Surge
The ASX 200 rebound is struggling for traction despite a powerful Wall Street rally, leaving 8800 resistance and downside risks in focus.

This report is intended for general circulation only. It should not be construed as a recommendation, or an offer (or solicitation of an offer) to buy or sell any financial products. The information provided does not take into account your specific investment objectives, financial situation or particular needs. Before you act on any recommendation that may be contained in this report, independent advice ought to be sought from a financial adviser regarding the suitability of the investment product, taking into account your specific investment objectives, financial situation or particular needs.
StoneX Financial Pte. Ltd., may distribute reports produced by its respective foreign entities or affiliates within the StoneX group of companies or third parties pursuant to an arrangement under Regulation 32C of the Financial Advisers Regulations. Where the report is distributed to a person in Singapore who is not an accredited investor, expert investor or an institutional investor (as defined in the Securities Futures Act), StoneX Financial Pte. Ltd. accepts legal responsibility to such persons for the contents of the report only to the extent required by law. Singapore recipients should contact StoneX Financial Pte. Ltd. at 6826 9988 for matters arising from, or in connection with the report.
In the case of all other recipients of this report, to the extent permitted by applicable laws and regulations neither StoneX Financial Pte. Ltd. nor its associated companies will be responsible or liable for any loss or damage incurred arising out of, or in connection with, any use of the information contained in this report and all such liability is hereby expressly disclaimed. No representation or warranty is made, express or implied, that the content of this report is complete or accurate.
StoneX Financial Pte. Ltd. is not under any obligation to update this report.
Trading CFDs carries a high level of risk that may not be suitable for some investors. Consider your investment objectives, level of experience, financial resources, risk appetite and other relevant circumstances carefully. The possibility exists that you could lose some or all of your investments, including your initial deposits. If in doubt, please seek independent expert advice. Visit www.forex.com/en-sg/terms-and-policies for the complete Risk Disclosure Statement.