



Nasdaq Launches Towards Highs as Rally Nears 15%
The April rally has only continued to intensify and Nasdaq futures are now closing in on a fresh all-time-high, even with an abundance of questions hovering over the Strait of Hormuz.
Share this:


Fundamentals are not a perfect push point for price. Sure, they can have sway, but in a true market environment, the lowest common denominator of price moves is actual buying and selling – supply and demand.
To be sure there will often be some form of relationship between the two – where headlines and fundamentals spur demand which pushes prices higher, and this can be such a common occurrence that many traders can delude themselves into thinking that there’s some inherent edge in following fundamentals. But the reality is it’s far from perfect and for the trader that’s been around long enough to have seen several cases of divergence, when bullish headlines don’t lead to fresh highs or when sour headlines don’t drive fresh lows, it’s enough to search elsewhere for motivation behind trading strategies and ideas.
In the Nasdaq 100 there’s actually a few cases of that, on either side, over the past six months, and this illustrates well not only the failure of fundamentals to have a direct and logical impact on price, but the futility in expecting the headlines to make sense.
For the current scenario, Nasdaq 100 futures are up almost 15% from the low of just three weeks ago, and price is fast approaching an important line in the sand at 26,349-26,399, which has stalled price twice over the past six months.
Will the third time at that zone be the charm for bulls?
Nasdaq 100 Futures – Weekly Price Chart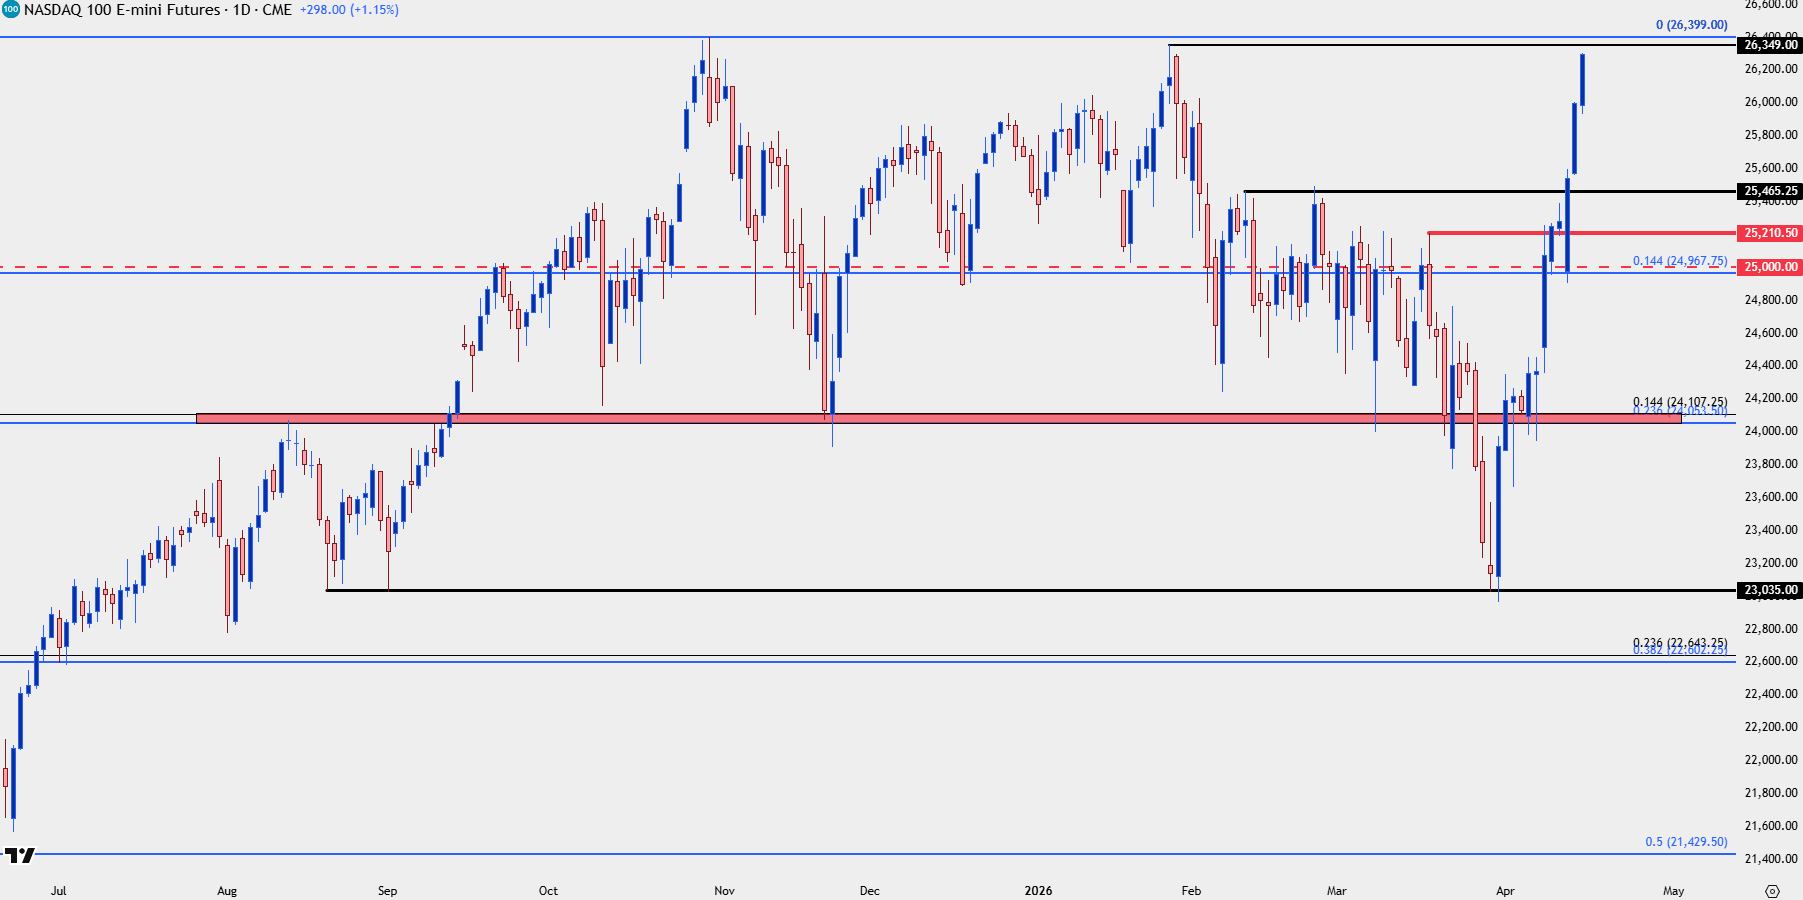
Chart prepared by James Stanley; data derived from Tradingview
The Nasdaq High
As we came into Q4 of last year stocks were ripping, backed by FOMC rate cuts and the prospect of continuation with a strong earnings backdrop to go along with soft monetary policy. But, in October, Powell didn’t sound so sure about a December rate cut and quickly stocks pulled back.
Even though the Fed did ultimately cut in December, the Nasdaq 100 was never able to re-claim the ATH, instead holding a lower-high in January just before another pullback began which hastened in March as fear around the Straight or Hormuz began to take over.
What is notable about that event, however, is how well the Nasdaq held up on a relative basis as buyers were using that pullback to take on exposure in names that were previously at stratospheric levels, such as NVDA.
And through it all, the pullback in NVDA remained rather light as the stock only retraced 23.6% of the 1862% rally that started from the 2022 lows. From the four-hour chart, we can see that initial bounce morphing into a strong case of FOMO as buyers have piled in with a fear of missing out.
Nasdaq 100 Four-Hour Chart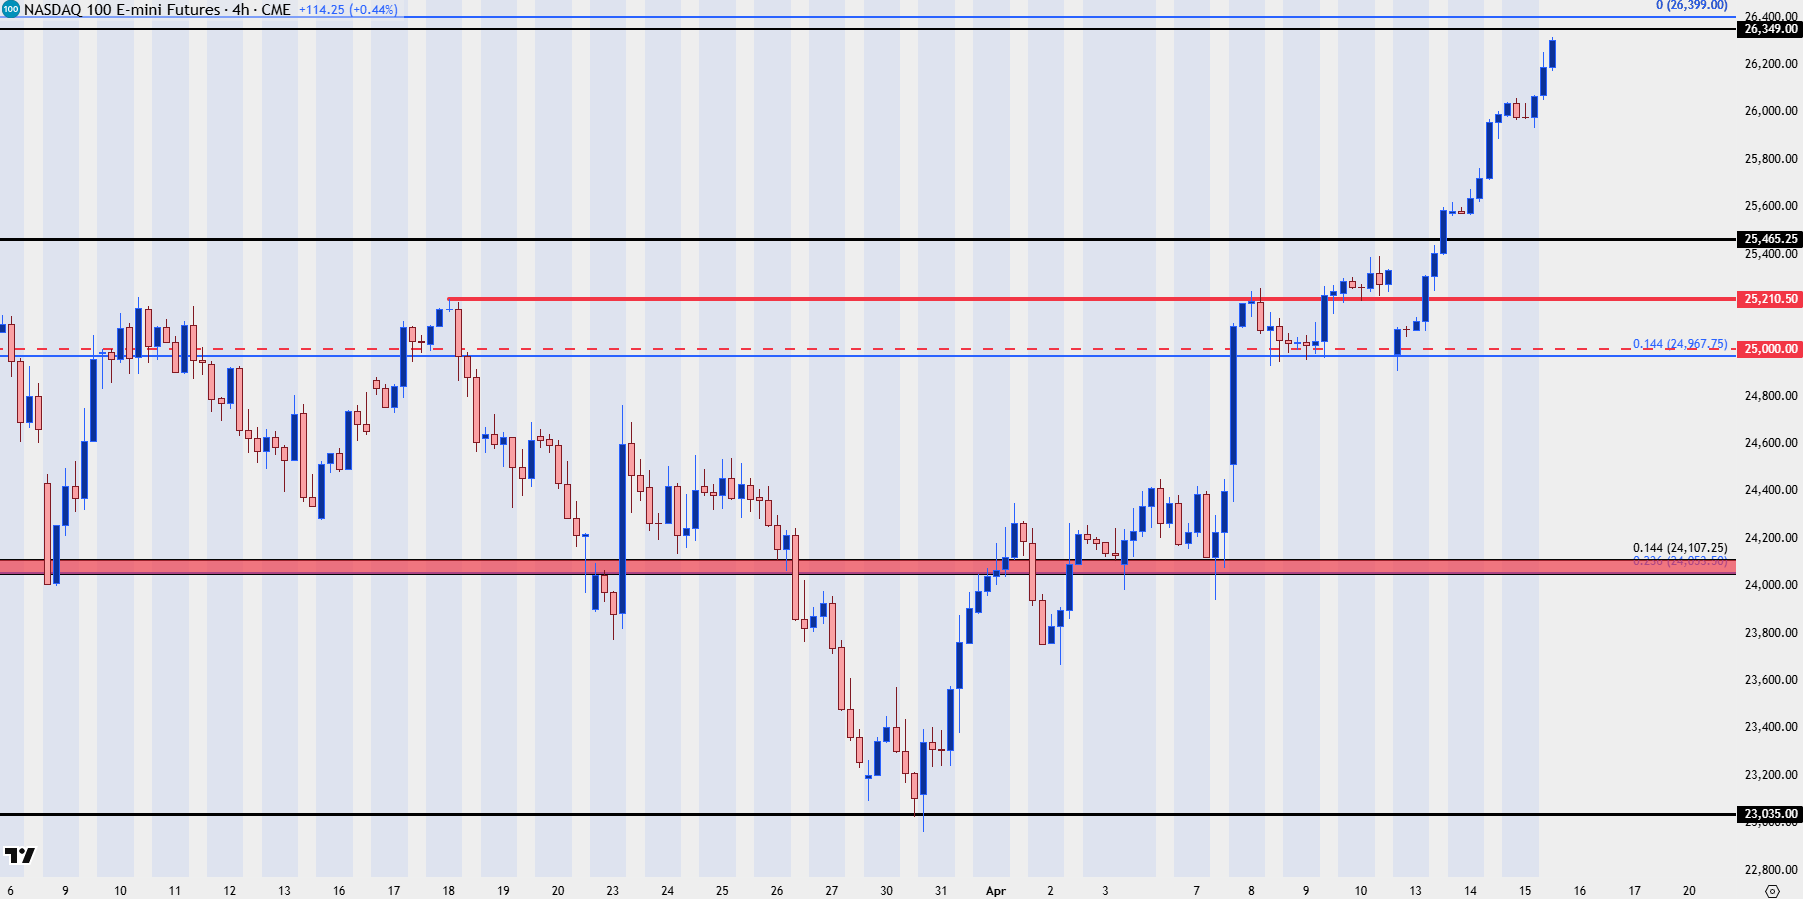
Chart prepared by James Stanley; data derived from Tradingview
--- written by James Stanley, Senior Market Analyst, Global Macro
Related tags:




Open an account in minutes
Experience award-winning platforms with fast and secure execution, and enjoy tight spreads from 0.5 pts on FX and 0.3 pts on indices.
Economic calendar
Web Trader platform
Our sophisticated web-based platform is packed with features.
Related articles

USD/JPY Bulls Continue to Push as Markets ‘Bet Against the House’
USD/JPY is now up by more than 500 pips from the low taken the day that Scott Bessent taunted markets, saying ‘you can bet against me if you want.’

EUR/USD, Nasdaq Price Outlook: Reversal Risks Build
EUR/USD and Nasdaq Price Outlook: Overbought/oversold momentum on hourly and daily time frames is raising reversal risks across the U.S. dollar, EUR/USD and Nasdaq after a strong weekly advance.


US Dollar Price Action Setups: USD/JPY, USD/CAD, EUR/USD, GBP/USD, Gold
The US Dollar has rallied since last week’s rate hike and USD/JPY remains a massive driver across the USD complex.
This report is intended for general circulation only. It should not be construed as a recommendation, or an offer (or solicitation of an offer) to buy or sell any financial products. The information provided does not take into account your specific investment objectives, financial situation or particular needs. Before you act on any recommendation that may be contained in this report, independent advice ought to be sought from a financial adviser regarding the suitability of the investment product, taking into account your specific investment objectives, financial situation or particular needs.
StoneX Financial Pte. Ltd., may distribute reports produced by its respective foreign entities or affiliates within the StoneX group of companies or third parties pursuant to an arrangement under Regulation 32C of the Financial Advisers Regulations. Where the report is distributed to a person in Singapore who is not an accredited investor, expert investor or an institutional investor (as defined in the Securities Futures Act), StoneX Financial Pte. Ltd. accepts legal responsibility to such persons for the contents of the report only to the extent required by law. Singapore recipients should contact StoneX Financial Pte. Ltd. at 6826 9988 for matters arising from, or in connection with the report.
In the case of all other recipients of this report, to the extent permitted by applicable laws and regulations neither StoneX Financial Pte. Ltd. nor its associated companies will be responsible or liable for any loss or damage incurred arising out of, or in connection with, any use of the information contained in this report and all such liability is hereby expressly disclaimed. No representation or warranty is made, express or implied, that the content of this report is complete or accurate.
StoneX Financial Pte. Ltd. is not under any obligation to update this report.
Trading CFDs carries a high level of risk that may not be suitable for some investors. Consider your investment objectives, level of experience, financial resources, risk appetite and other relevant circumstances carefully. The possibility exists that you could lose some or all of your investments, including your initial deposits. If in doubt, please seek independent expert advice. Visit www.forex.com/en-sg/terms-and-policies for the complete Risk Disclosure Statement.