




Opportunities emerge as storm eases Gold and Silver
As September comes to a close, the storm it bought is set to ease. In its trail, few asset classes were left untouched, with precious metals the latest to feel its impact.
Share this:

In some ways, the September storm bought a much-needed wash out of the extreme excesses that had built in recent months. Few markets exhibited quite as bullish exuberance as Silver, up over 150% in 6 months!
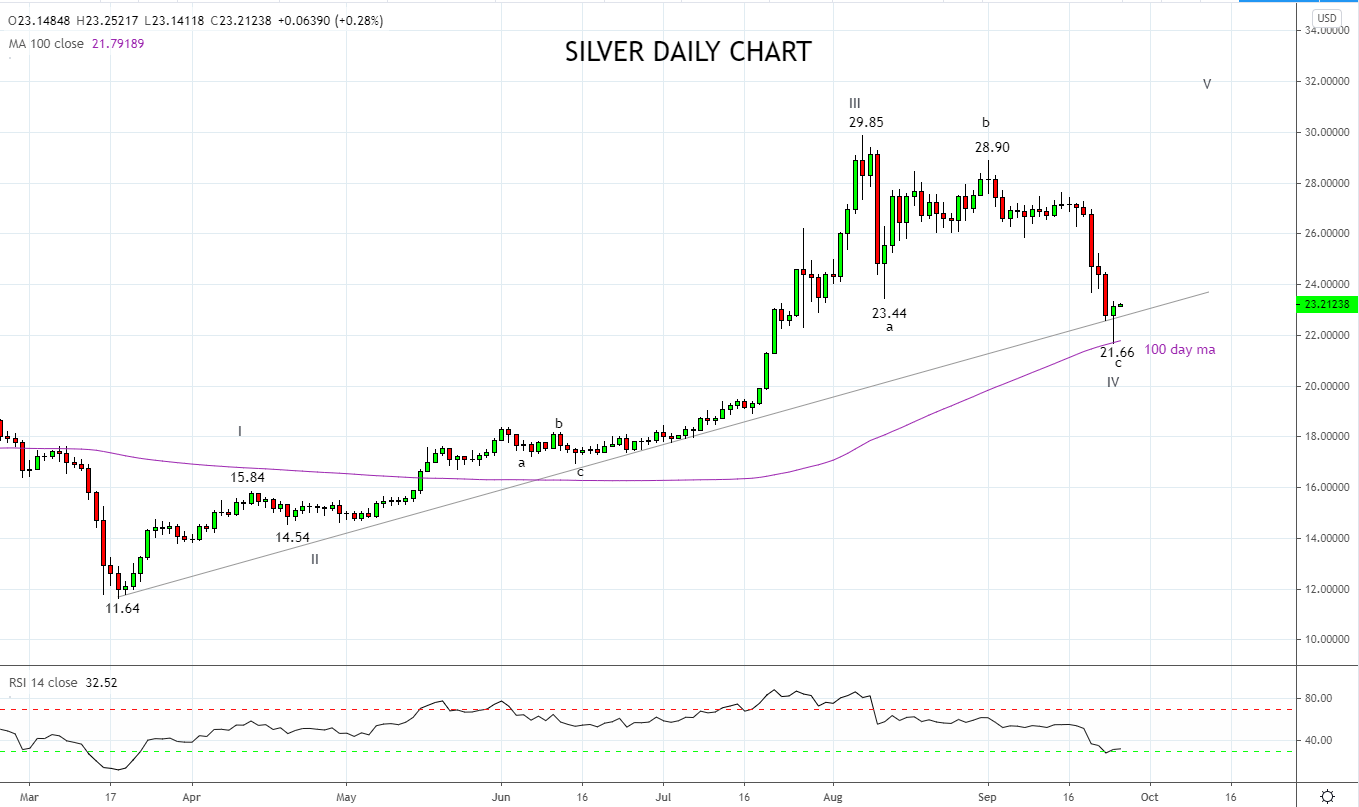
Enthusiasts of textbook definitions will note that Silver entered bear market territory overnight. However as can be viewed on the chart below, it may turn out to be one of the quickest bear markets in history.
The pullback from the August $29.85 high is viewed as a correction. The false break lower overnight neatly tagged the support coming from the 100-day moving average. The daily close back above trendline support and the potentially bullish daily reversal candle providing initial confirmation the corrective pullback is complete.
Should Silver, remain above the overnight low and then break and close above the band of resistance $23.50/24.00, it would suggest the uptrend has resumed (Wave V). In this instance, the expectation would be for a retest and break of the $29.85 high into year-end.
Silvers high beta characteristics makes it a leader in the precious metal space, similar to the way the Nasdaq is for other U.S equity indices. However, Silvers volatility means that it is one that only the bravest will trade.
In this respect, gold is viewed as the preferred precious metal vehicle to trade and displays a similar technical structure to Silver.
While the pullback in Gold fell well short of wave equality at $1800, it also tagged the support provided by the 100 day moving average, before a potentially bullish daily candle formed.
Should gold hold above the overnight lows at $1849 and then trade above $1883.00 ($6.00 above the overnight high of $1877), I would consider opening a small long trade with a stop loss placed at $1841. The target for is a retest and break of the $2075 high, before $2400.
Keeping in mind, a break and close above the band of resistance $1910/20 would be further confirmation the uptrend has resumed.
Source Tradingview. The figures stated areas of the 25th of September 2020. Past performance is not a reliable indicator of future performance. This report does not contain and is not to be taken as containing any financial product advice or financial product recommendation
Related tags:
Latest market news




Open an account in minutes
Experience award-winning platforms with fast and secure execution, and enjoy tight spreads from 0.5 pts on FX and 0.3 pts on indices.
Economic calendar
Web Trader platform
Our sophisticated web-based platform is packed with features.
Related articles
Gold, silver slammed as hawkish Fed repricing reignites dollar upside
Gold and silver had held up surprisingly well against surging US yields. Wednesday’s DXY breakout may have changed that equation.

Gold Analysis: Rising Yields and Dollar Strength Weigh on XAU/USD
The trading week continues, and for now gold remains under notable pressure in the short term. This can be seen in the performance of XAU/USD over the last three trading sessions, where the metal has declined by more than 2.00%, bringing a bearish bias back into focus after it had lost momentum in recent weeks.


EUR/USD, Gold Forecast: Two trades to watch
EUR/USD falls to a 2-month low despite Eurozone growth picking up. Gold under pressure as a stronger USD offsets falling oil prices.

This report is intended for general circulation only. It should not be construed as a recommendation, or an offer (or solicitation of an offer) to buy or sell any financial products. The information provided does not take into account your specific investment objectives, financial situation or particular needs. Before you act on any recommendation that may be contained in this report, independent advice ought to be sought from a financial adviser regarding the suitability of the investment product, taking into account your specific investment objectives, financial situation or particular needs.
StoneX Financial Pte. Ltd., may distribute reports produced by its respective foreign entities or affiliates within the StoneX group of companies or third parties pursuant to an arrangement under Regulation 32C of the Financial Advisers Regulations. Where the report is distributed to a person in Singapore who is not an accredited investor, expert investor or an institutional investor (as defined in the Securities Futures Act), StoneX Financial Pte. Ltd. accepts legal responsibility to such persons for the contents of the report only to the extent required by law. Singapore recipients should contact StoneX Financial Pte. Ltd. at 6826 9988 for matters arising from, or in connection with the report.
In the case of all other recipients of this report, to the extent permitted by applicable laws and regulations neither StoneX Financial Pte. Ltd. nor its associated companies will be responsible or liable for any loss or damage incurred arising out of, or in connection with, any use of the information contained in this report and all such liability is hereby expressly disclaimed. No representation or warranty is made, express or implied, that the content of this report is complete or accurate.
StoneX Financial Pte. Ltd. is not under any obligation to update this report.
Trading CFDs carries a high level of risk that may not be suitable for some investors. Consider your investment objectives, level of experience, financial resources, risk appetite and other relevant circumstances carefully. The possibility exists that you could lose some or all of your investments, including your initial deposits. If in doubt, please seek independent expert advice. Visit www.forex.com/en-sg/terms-and-policies for the complete Risk Disclosure Statement.