



S&P 500 Forecast: What Do Record Highs and a Low VIX Mean Historically?
A record S&P 500 close combined with subdued volatility has historically looked more like a stable bullish regime than a sign of complacency immediately preceding a major reversal - see what the historical data shows!
Share this:
S&P 500 Key Takeaways
- Friday’s record high was accompanied by an unusually low < 15 reading on the VIX.
- A record S&P 500 close combined with subdued volatility has historically looked more like a stable bullish regime than a sign of complacency immediately preceding a major reversal.
- None of the prior 40 signals experienced a -10% closing drawdown over the following 13 weeks, versus roughly 14% of ordinary periods.
Despite (or arguably, because of) the weaker-than-expected US jobs report, the S&P 500 set a record high Friday.
The S&P 500 has set 27 record highs already this year, so that isn’t remarkable in itself, but the record high was accompanied by an unusually low reading on the Volatility Index, or VIX, which closed last week below 15. This combination of record highs and low expected volatility is relatively rare.
Filtering out some of the overlapping signals by only counting the first such instance in at least four weeks, there have been only 40 times that the S&P 500 has set a record high with the VIX below 15 since since the VIX was created in 1990.
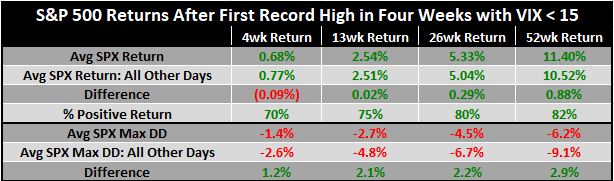
Looking at these past instances is revealing. As the table below shows, the average near-term S&P 500 returns are slightly lower than all other periods, while the longer-term returns are generally more positive. More significantly, the average drawdown is meaningfully lower across all the timeframes studied:
Source: StoneX. Past performance is not necessarily indicative of future returns.
In other words, an all-time high combined with subdued volatility has historically looked more like a stable bullish regime than a sign of complacency immediately preceding a major reversal. None of the prior 40 signals experienced a -10% closing drawdown over the following 13 weeks, versus roughly 14% of ordinary periods.
By itself, this is just one study of market behavior, but it adds to other bullish signals to suggest that the current bull market could have further to run, especially over the medium-term, and that a low VIX should not automatically viewed as excessive complacency.
S&P 500 Technical Analysis: SPX Daily Chart
Source: Tradingview, StoneX
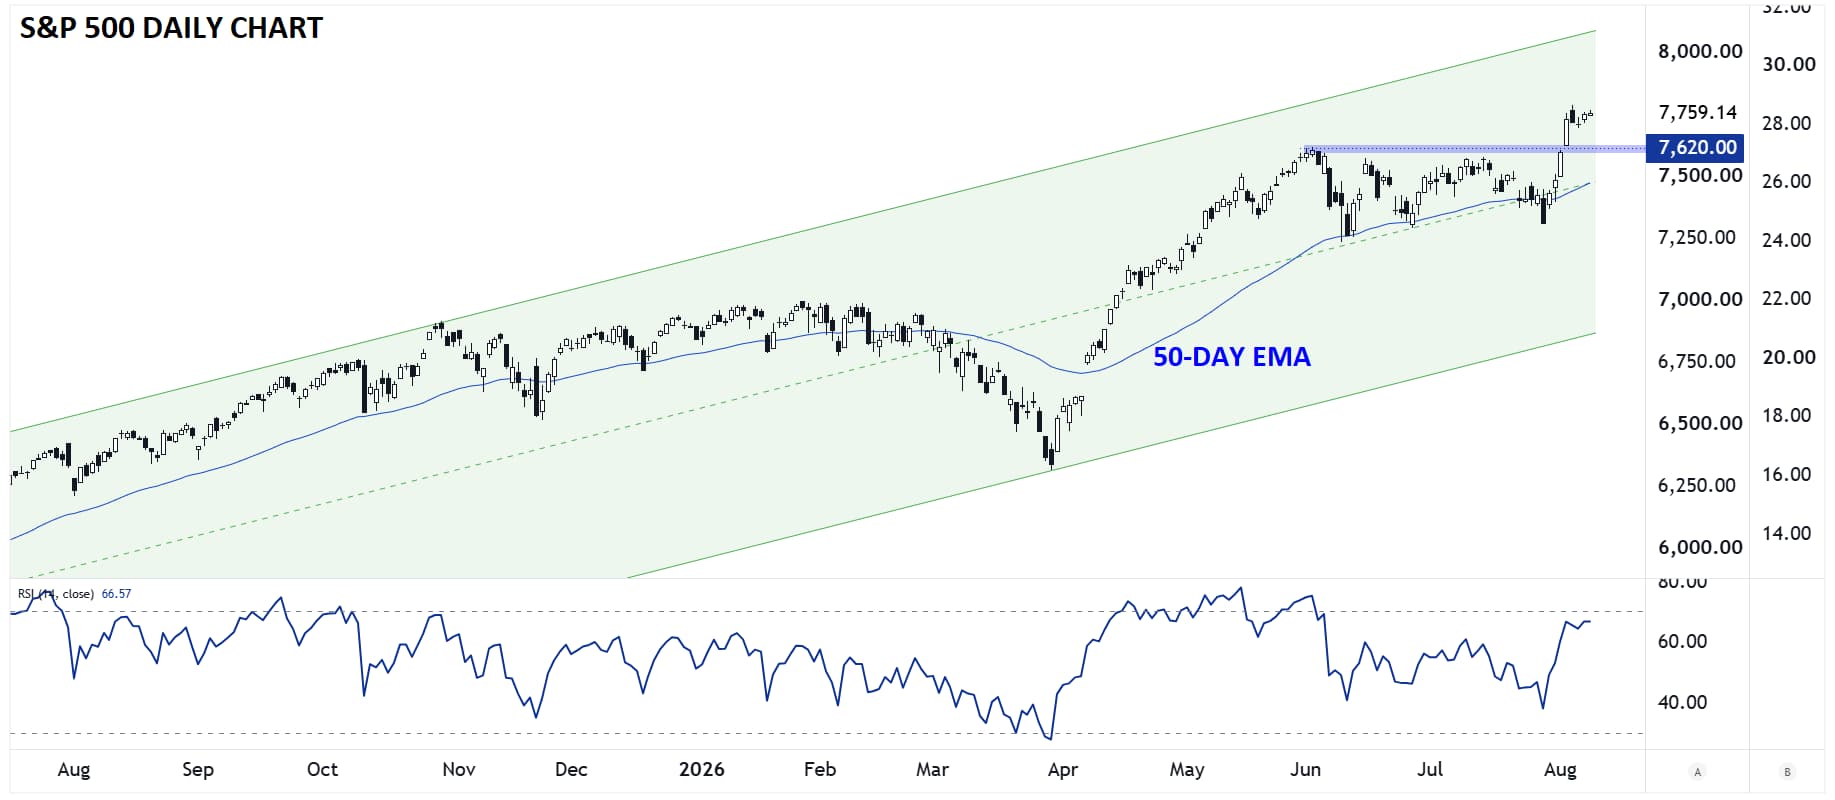
Looking at the chart of the S&P 500, the index is trading comfortably within its 17-month bullish channel, with room to run further toward 8,000 before encountering meaningful resistance. Having just broken out of a 3-month consolidation range, the odds favor continued gains as long as the index remains above the previous all-time high at 7620 and the rising 50-day EMA near 7500.
A break below those support levels would raise fears of a failed breakout and could open the door for a move toward the bottom of the rising channel near 7,000.
-- Written by Matt Weller, Global Head of Research
Check out Matt’s Daily Market Update videos on YouTube and be sure to follow Matt on Twitter: @MWellerFX
Related tags:
Latest market news




Open an account in minutes
Experience award-winning platforms with fast and secure execution, and enjoy tight spreads from 0.5 pts on FX and 0.3 pts on indices.
Economic calendar
Web Trader platform
Our sophisticated web-based platform is packed with features.
Related articles
Gold, silver slammed as hawkish Fed repricing reignites dollar upside
Gold and silver had held up surprisingly well against surging US yields. Wednesday’s DXY breakout may have changed that equation.
Euro Short-term Outlook: EUR/USD Selloff Nears Critical Yearly Support 9 23 2026
Euro has fallen seven of the past nine sessions, with stretched momentum raising the stakes as EUR/USD closes in on a major inflection zone.


Australian Dollar Technical Outlook: AUD/USD Breakdown Threatens Deeper Correction 9 23 2026
AUD/USD remains under pressure after breaking key trend support, with the latest decline putting the focus on the next major downside pivot.
This report is intended for general circulation only. It should not be construed as a recommendation, or an offer (or solicitation of an offer) to buy or sell any financial products. The information provided does not take into account your specific investment objectives, financial situation or particular needs. Before you act on any recommendation that may be contained in this report, independent advice ought to be sought from a financial adviser regarding the suitability of the investment product, taking into account your specific investment objectives, financial situation or particular needs.
StoneX Financial Pte. Ltd., may distribute reports produced by its respective foreign entities or affiliates within the StoneX group of companies or third parties pursuant to an arrangement under Regulation 32C of the Financial Advisers Regulations. Where the report is distributed to a person in Singapore who is not an accredited investor, expert investor or an institutional investor (as defined in the Securities Futures Act), StoneX Financial Pte. Ltd. accepts legal responsibility to such persons for the contents of the report only to the extent required by law. Singapore recipients should contact StoneX Financial Pte. Ltd. at 6826 9988 for matters arising from, or in connection with the report.
In the case of all other recipients of this report, to the extent permitted by applicable laws and regulations neither StoneX Financial Pte. Ltd. nor its associated companies will be responsible or liable for any loss or damage incurred arising out of, or in connection with, any use of the information contained in this report and all such liability is hereby expressly disclaimed. No representation or warranty is made, express or implied, that the content of this report is complete or accurate.
StoneX Financial Pte. Ltd. is not under any obligation to update this report.
Trading CFDs carries a high level of risk that may not be suitable for some investors. Consider your investment objectives, level of experience, financial resources, risk appetite and other relevant circumstances carefully. The possibility exists that you could lose some or all of your investments, including your initial deposits. If in doubt, please seek independent expert advice. Visit www.forex.com/en-sg/terms-and-policies for the complete Risk Disclosure Statement.