




sp 500 cautious on the recent rally 1852422017
<p>Short-term Technical Outlook (Wed, 24 May 2017) (Click to enlarge charts) What happened earlier/yesterday Despite all the negative typical “risk –off” events that sprouted out […]</p>
Share this:

Short-term Technical Outlook (Wed, 24 May 2017)
(Click to enlarge charts)
What happened earlier/yesterday
Despite all the negative typical “risk –off” events that sprouted out since Monday, 22 May 2017 such as the test firing of another ballistic missile from North Korea on Sunday, the tragic terrorist attack that occurred in Manchester, U.K and the today’s downgrade of China’s sovereign debt ratings from Moody’s to A1 from Aa3 due to rising financial risks from an increasing debt burden caused by previous credit-fueled stimulus (this is the first time in 30 years that China got a credit downgrade), the S&P 500 Index (proxy for the S&P 500 futures) had continued to inch higher and recovered the losses inflicted by U.S. President Trump’s political saga.
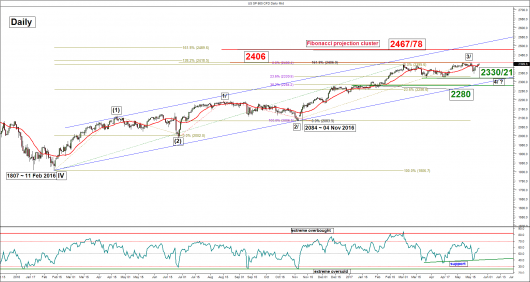
Yesterday’s close of the Index at 2398 had marked three consecutive higher closes since 18 May 2017 and surpassed our 2395 medium-term pivotal resistance set for this week. However, we are quite reluctant to turn outright bullish at this juncture due to the following technical elements.
Key technical elements
- From its minor swing low of 2379 seen on 22 May 2017, the Index has started to evolve within a bearish “Descending Wedge” configuration. In addition, the corresponding hourly RSI oscillator has started to trace out a bearish divergence since the start of this up move in price action from the 22 May 2017 minor swing low. These observations suggest that upside momentum of price action has started to wane (see 1 hour chart).
- Yesterday’s price action of the Index has led it to recapture the 20-day Moving Average and traded back above it. However, after a closer examination from market breath studies, the percentage of the stocks in the S&P 500 that are above the 20-day Moving Average is still below a mean value of 58.08 (period of calculation is taken from the start of the on-going medium-term uptrend of the Index from 11 Feb 2016 to 23 May 2017). These observations suggest that the recent push up in the Index is attributed by only “a few stocks” rather than a broad-based participation (see daily & the 3rd charts).
Key levels (1 to 3 days)
Pivot (key resistance): 2406
Supports: 2388 & 2370/67 (50%/61.8% Fib retracement of the up move from 18 May 2017 low)
Next resistance: 2422 (1.00 Fib projection of the up move from 18 May low to 20 May 2017 high)
Conclusion
Therefore, we maintain the bearish bias and tolerate the excess to 2409 but the Index needs to break below 2388 to open up scope for a potential corrective decline to target the 2370/67 support zone in the first step.
On the other hand, a clearance above 2409 is likely to invalidate the bearish bias and kick-start another upleg towards 2422 next in the short-term.
Charts are from City Index Advantage TraderPro & IndexIndicators.com
Disclaimer
This report is intended for general circulation only. It should not be construed as a recommendation, or an offer (or solicitation of an offer) to buy or sell any financial products. The information provided does not take into account your specific investment objectives, financial situation or particular needs. Before you act on any recommendation that may be contained in this email, independent advice ought to be sought from a financial adviser regarding the suitability of the investment product, taking into account your specific investment objectives, financial situation or particular needs. All queries regarding the contents of this material are to be directed to City Index, a trading name of GAIN Capital Singapore Pte Ltd.
Trading CFDs and FX on margin carries a high level of risk that may not be suitable for some investors. Consider your investment objectives, level of experience, financial resources, risk appetite and other relevant circumstances carefully. The possibility exists that you could lose some or all of your investments, including your initial deposits. If in doubt, please seek independent expert advice. Visit cityindex.com.sg for the complete Risk Disclosure Statement.

Related tags:
Latest market news




Open an account in minutes
Experience award-winning platforms with fast and secure execution, and enjoy tight spreads from 0.5 pts on FX and 0.3 pts on indices.
Economic calendar
Web Trader platform
Our sophisticated web-based platform is packed with features.
Related articles
This report is intended for general circulation only. It should not be construed as a recommendation, or an offer (or solicitation of an offer) to buy or sell any financial products. The information provided does not take into account your specific investment objectives, financial situation or particular needs. Before you act on any recommendation that may be contained in this report, independent advice ought to be sought from a financial adviser regarding the suitability of the investment product, taking into account your specific investment objectives, financial situation or particular needs.
StoneX Financial Pte. Ltd., may distribute reports produced by its respective foreign entities or affiliates within the StoneX group of companies or third parties pursuant to an arrangement under Regulation 32C of the Financial Advisers Regulations. Where the report is distributed to a person in Singapore who is not an accredited investor, expert investor or an institutional investor (as defined in the Securities Futures Act), StoneX Financial Pte. Ltd. accepts legal responsibility to such persons for the contents of the report only to the extent required by law. Singapore recipients should contact StoneX Financial Pte. Ltd. at 6826 9988 for matters arising from, or in connection with the report.
In the case of all other recipients of this report, to the extent permitted by applicable laws and regulations neither StoneX Financial Pte. Ltd. nor its associated companies will be responsible or liable for any loss or damage incurred arising out of, or in connection with, any use of the information contained in this report and all such liability is hereby expressly disclaimed. No representation or warranty is made, express or implied, that the content of this report is complete or accurate.
StoneX Financial Pte. Ltd. is not under any obligation to update this report.
Trading CFDs carries a high level of risk that may not be suitable for some investors. Consider your investment objectives, level of experience, financial resources, risk appetite and other relevant circumstances carefully. The possibility exists that you could lose some or all of your investments, including your initial deposits. If in doubt, please seek independent expert advice. Visit www.forex.com/en-sg/terms-and-policies for the complete Risk Disclosure Statement.