





Stocks Shake on Tariff Delay Take-Back: S&P 500, Nasdaq Levels
Once again stocks gapped down, but this time, a rally ensued even with a tariff pause headline being walked back by the Trump administration.
Share this:

Equities Talking Points:
- The week is still early but already there’s been massive volatility in equities, with an initial gap-down faded aggressively on news of a possible 90-day pause in tariff implementation.
- That 90-day pause in tariff implementation was quickly walked back by the White House, and stocks pulled back down again in response. But, at this point, stocks are holding higher-lows off the overnight swings and S&P 500 futures are holding very near last week’s close.
The wild ride through global markets continues through the weekly open. While the weekend was punctuated with Jim Cramer calling for another ‘Black Monday’ or Bill Ackman warning that President Trump needed to tone down the tariff rhetoric, price action in stocks so far probably hasn’t been as bad as many expected. Sure, there was a gap down and an initial thrust lower in futures last night. But, at this point, that swing low from the open yesterday is the peak low, and there’s since been two higher-lows that have built after that.
The weekly opening gap has been filled but there was a bit of noise setting that up: A rumor quickly circulated across the media that the Trump administration was considering a 90-day pause on tariff implementation. Shorts were quickly squeezed as equities rallied in a big way, with the S&P 500 putting in a max move of +9.41% from the overnight lows.
That report was walked back shortly after, however, and prices sank again – but to this point, they have held support at prior resistance which can keep the door open for a wider pullback.
I talked about stocks in this week’s equity forecast and as I highlighted there, we’ve seen oversold conditions on the weekly chart of the S&P 500 for the first time in over a year. The sell-off last week was intense, and it’s difficult to chase those moves lower given the quick imbalance of sellers that’s entered the market; so there can be a short squeeze type of backdrop, especially on headline-driven scenarios such as we’ve seen so far this morning.
S&P 500 30-Minute Price Chart
 Chart prepared by James Stanley; data derived from Tradingview
S&P Bigger Picture
Given the pandemonium in the headlines, it’s probably going to be difficult to attach to any trends in the near-term, as directional moves could quickly be swashed away by the next comment or social media item.
Swing trading, however, could at least present the opportunity for asymmetry so that if the trader does find themselves on the ‘right’ side of a move, the benefit could outweigh the risk outlay.
There are already some big levels in play on the S&P 500, as it’s the 50% retracement of the 2022-2025 major move that has so far set the low for this week. And the 38.2% retracement is currently in-play as short-term resistance as you can see from the above 30-minute chart.
S&P 500 Weekly Price Chart
 Chart prepared by James Stanley; data derived from Tradingview
From the daily chart, we can glimpse a couple of additional levels that remain important: The 5k level is a key area for bulls to try to defend if they did want to prolong the pullback, and overhead, the daily high at 5286 is the spot that they would need to take-out to take more control of the move. Above that, it’s the 5537 Fibonacci level that remains key as this set support in March over a few days and again last Monday before sellers were ultimately able to take it out. That’s now resistance potential on prolonged pullback/short squeeze scenarios.
S&P 500 Daily Price Chart
 Chart prepared by James Stanley; data derived from Tradingview
Nasdaq 100
The Nasdaq has also found support at the 50% retracement of its 2022-2025 major move and that’s led to a sizable bounce so far. Resistance, however, has held from another key level as taken from the 50% mark of the 2023-2025 major move, which is also a swing low from last September, plotting from around 18.283.
Nasdaq 100 Weekly Price Chart
 Chart prepared by James Stanley; data derived from Tradingview
Nasdaq Shorter-Term
From the four-hour chart we can glean a few additional levels of note, as the 61.8% retracement of the shorter-term move is now set up for support potential at 17,305. For resistance, there’s the 38.2% marker of the longer-term move at 17,864 and if bulls can rally through that, the 18,283 level is opened up for another test, which is what buyers would need to overcome to take greater control of the move.
I realize that given the headlines the upside of either scenario may seem an outlandish prospect, but with how aggressively bears hit this last week, given the stall so far this week, there could be a drive towards profit taking which could lead to a stronger short-squeeze situation.
As for whether this is a long-term bottom, that question would likely have something do with bonds as it seems a clear motive of the administration is to lower Treasury yields. And with the 10-year trading around 4%, there would be a lot of room for bond yields to move lower (and prices higher) if the anticipation was that Treasury yields would continue to fall on the back of the tariff campaign.
Nasdaq 100 Four-Hour Chart
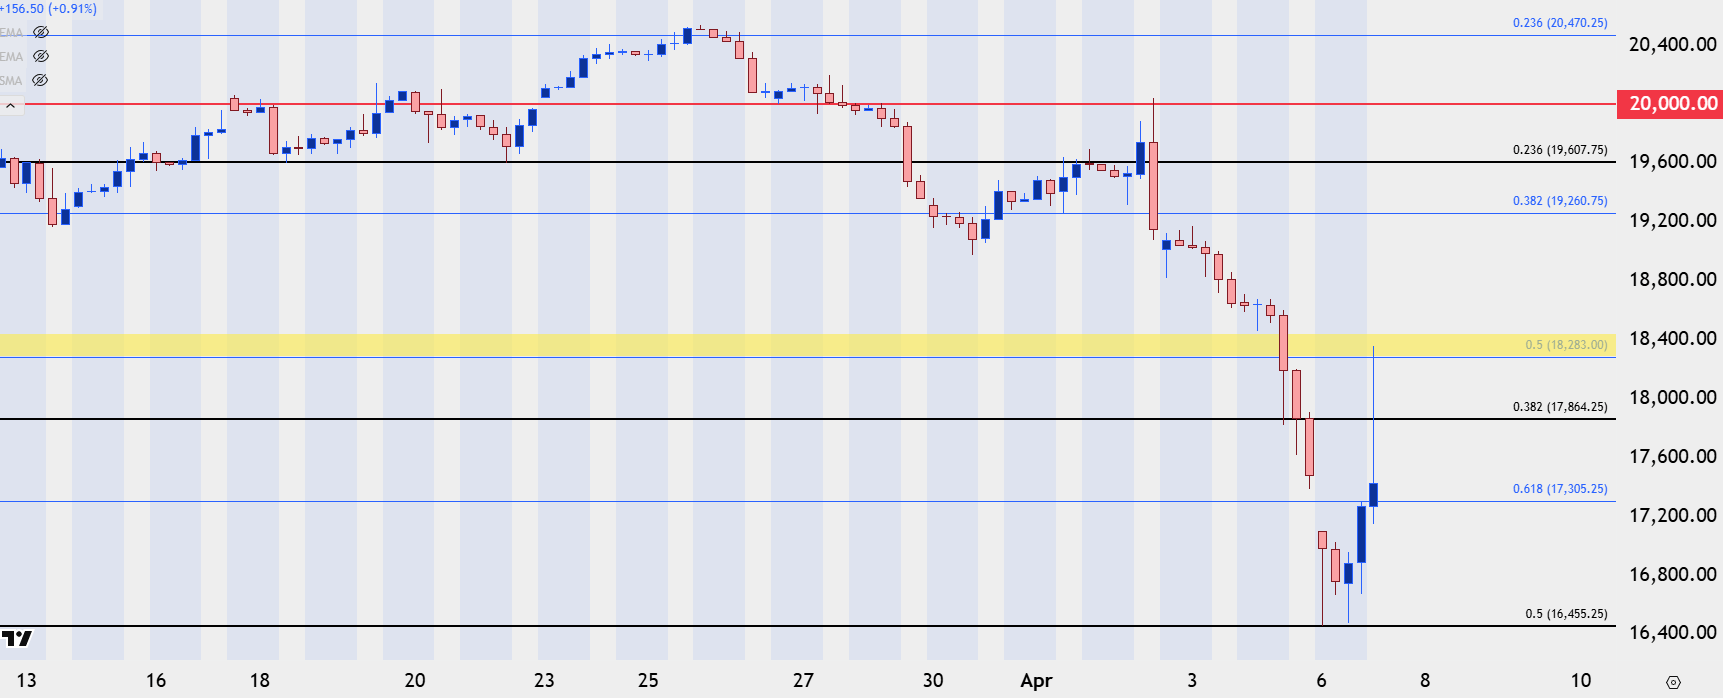 Chart prepared by James Stanley; data derived from Tradingview
--- written by James Stanley, Senior Strategist
This content will only appear on City Index websites!
Equities Talking Points:
- The week is still early but already there’s been massive volatility in equities, with an initial gap-down faded aggressively on news of a possible 90-day pause in tariff implementation.
- That 90-day pause in tariff implementation was quickly walked back by the White House, and stocks pulled back down again in response. But, at this point, stocks are holding higher-lows off the overnight swings and S&P 500 futures are holding very near last week’s close.
The wild ride through global markets continues through the weekly open. While the weekend was punctuated with Jim Cramer calling for another ‘Black Monday’ or Bill Ackman warning that President Trump needed to tone down the tariff rhetoric, price action in stocks so far probably hasn’t been as bad as many expected. Sure, there was a gap down and an initial thrust lower in futures last night. But, at this point, that swing low from the open yesterday is the peak low, and there’s since been two higher-lows that have built after that.
The weekly opening gap has been filled but there was a bit of noise setting that up: A rumor quickly circulated across the media that the Trump administration was considering a 90-day pause on tariff implementation. Shorts were quickly squeezed as equities rallied in a big way, with the S&P 500 putting in a max move of +9.41% from the overnight lows.
That report was walked back shortly after, however, and prices sank again – but to this point, they have held support at prior resistance which can keep the door open for a wider pullback.
I talked about stocks in this week’s equity forecast and as I highlighted there, we’ve seen oversold conditions on the weekly chart of the S&P 500 for the first time in over a year. The sell-off last week was intense, and it’s difficult to chase those moves lower given the quick imbalance of sellers that’s entered the market; so there can be a short squeeze type of backdrop, especially on headline-driven scenarios such as we’ve seen so far this morning.
S&P 500 30-Minute Price Chart
Chart prepared by James Stanley; data derived from Tradingview
S&P Bigger Picture
Given the pandemonium in the headlines, it’s probably going to be difficult to attach to any trends in the near-term, as directional moves could quickly be swashed away by the next comment or social media item.
Swing trading, however, could at least present the opportunity for asymmetry so that if the trader does find themselves on the ‘right’ side of a move, the benefit could outweigh the risk outlay.
There are already some big levels in play on the S&P 500, as it’s the 50% retracement of the 2022-2025 major move that has so far set the low for this week. And the 38.2% retracement is currently in-play as short-term resistance as you can see from the above 30-minute chart.
S&P 500 Weekly Price Chart
Chart prepared by James Stanley; data derived from Tradingview
From the daily chart, we can glimpse a couple of additional levels that remain important: The 5k level is a key area for bulls to try to defend if they did want to prolong the pullback, and overhead, the daily high at 5286 is the spot that they would need to take-out to take more control of the move. Above that, it’s the 5537 Fibonacci level that remains key as this set support in March over a few days and again last Monday before sellers were ultimately able to take it out. That’s now resistance potential on prolonged pullback/short squeeze scenarios.
S&P 500 Daily Price Chart
Chart prepared by James Stanley; data derived from Tradingview
Nasdaq 100
The Nasdaq has also found support at the 50% retracement of its 2022-2025 major move and that’s led to a sizable bounce so far. Resistance, however, has held from another key level as taken from the 50% mark of the 2023-2025 major move, which is also a swing low from last September, plotting from around 18.283.
Nasdaq 100 Weekly Price Chart
Chart prepared by James Stanley; data derived from Tradingview
Nasdaq Shorter-Term
From the four-hour chart we can glean a few additional levels of note, as the 61.8% retracement of the shorter-term move is now set up for support potential at 17,305. For resistance, there’s the 38.2% marker of the longer-term move at 17,864 and if bulls can rally through that, the 18,283 level is opened up for another test, which is what buyers would need to overcome to take greater control of the move.
I realize that given the headlines the upside of either scenario may seem an outlandish prospect, but with how aggressively bears hit this last week, given the stall so far this week, there could be a drive towards profit taking which could lead to a stronger short-squeeze situation.
As for whether this is a long-term bottom, that question would likely have something do with bonds as it seems a clear motive of the administration is to lower Treasury yields. And with the 10-year trading around 4%, there would be a lot of room for bond yields to move lower (and prices higher) if the anticipation was that Treasury yields would continue to fall on the back of the tariff campaign.
Nasdaq 100 Four-Hour Chart
Chart prepared by James Stanley; data derived from Tradingview
--- written by James Stanley, Senior Strategist
Related tags:
Latest market news




Open an account in minutes
Experience award-winning platforms with fast and secure execution, and enjoy tight spreads from 0.5 pts on FX and 0.3 pts on indices.
Economic calendar
Web Trader platform
Our sophisticated web-based platform is packed with features.
Related articles
Nasdaq Breakout Potential into Q4 for Melt Up Scenarios
The headlines seem negative in almost any place that you look, with surging Treasury yields and frothy AI valuations getting more and more attention. But, if it’s so bad, why hasn’t the Nasdaq melted down yet, even as the Fed has started hiking rates?
S&P 500 Forecast: SPX rises after cooler-than-expected inflation data
U.S. stocks are rising and Treasury yields are falling after data showed that inflation increased at a cooler pace than expected, while U.S. consumer spending rose again in August.

The RBA Hiked Rates and the Australian Dollar Still Fell
AUD/USD fell after the RBA rate hike because the central bank's hawkish stance was already priced in while the U.S. dollar stayed firm.

This report is intended for general circulation only. It should not be construed as a recommendation, or an offer (or solicitation of an offer) to buy or sell any financial products. The information provided does not take into account your specific investment objectives, financial situation or particular needs. Before you act on any recommendation that may be contained in this report, independent advice ought to be sought from a financial adviser regarding the suitability of the investment product, taking into account your specific investment objectives, financial situation or particular needs.
StoneX Financial Pte. Ltd., may distribute reports produced by its respective foreign entities or affiliates within the StoneX group of companies or third parties pursuant to an arrangement under Regulation 32C of the Financial Advisers Regulations. Where the report is distributed to a person in Singapore who is not an accredited investor, expert investor or an institutional investor (as defined in the Securities Futures Act), StoneX Financial Pte. Ltd. accepts legal responsibility to such persons for the contents of the report only to the extent required by law. Singapore recipients should contact StoneX Financial Pte. Ltd. at 6826 9988 for matters arising from, or in connection with the report.
In the case of all other recipients of this report, to the extent permitted by applicable laws and regulations neither StoneX Financial Pte. Ltd. nor its associated companies will be responsible or liable for any loss or damage incurred arising out of, or in connection with, any use of the information contained in this report and all such liability is hereby expressly disclaimed. No representation or warranty is made, express or implied, that the content of this report is complete or accurate.
StoneX Financial Pte. Ltd. is not under any obligation to update this report.
Trading CFDs carries a high level of risk that may not be suitable for some investors. Consider your investment objectives, level of experience, financial resources, risk appetite and other relevant circumstances carefully. The possibility exists that you could lose some or all of your investments, including your initial deposits. If in doubt, please seek independent expert advice. Visit www.forex.com/en-sg/terms-and-policies for the complete Risk Disclosure Statement.