



technical highlights on apple aapl further potential downside pressure below 112 40 1808382016
<p>Today major event in the equities space will be Apple’s first quarter earnings result after the close which will have major ramifications in the financial […]</p>
Share this:

Today major event in the equities space will be Apple’s first quarter earnings result after the close which will have major ramifications in the financial markets globally. Firstly, it is a heavy weight in the major U.S. benchmark stock indices where it has a weightage of 3.2% in the S&P 500 and 11.38% in the Nasdaq 100, thus its price movement will have a major impact in direction of these indices at least in the short-term.
Secondly in the recent quarters, sales of Apple products (especially iPhones) are more dependent on the overseas markets with a major share in China. Any slowdown in sales figures for the China market will indicate weakness in consumer demand which can be taken as a gauge that the internal demand growth in China faces the risk of a slowdown. Even though Chinese government policy makers have enacted countless accommodating monetary measures to reduce the risk of a hard landing as China reduces the overcapacity seen in its manufacturing sector that has built-up over the past 6 years (Remember the global sell-off seen in equities that occurred in August 2015 and the start of this year?)
Analysts polled by FactSet expect Q1 2016 earnings of $2.00 per share on the average which represents a decline of 14% y/y from the same quarter a year ago at $2.33 per share. If Apple reports actual earnings that show a y/y decline, it will be the first time the company has reported a y/y decline in earnings per share since Q3 2013.
Let’s us take a deep dive into Apple from a technical analysis perspective
Key elements
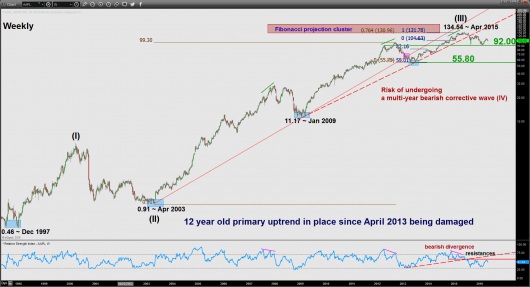
- As seen from the weekly chart, the primary bullish uptrend in place since April 2003 low of 0.91 (adjusted for stock splits) has been damaged as the stock has broken below multiple trendline supports from April 2003 low and January 2009 low.
- The weekly (long-term) RSI oscillator remains bearish below its resistances and has not reached an extreme oversold level. In addition, it has also flashed a prior bearish divergence signal. These observations suggest that downside momentum of price action remains intact.
- Based on the Elliot Wave Principal and fractal analysis, Apple is likely to be still in a secular long-term bullish trend but on the primary time frame, it has completed a potential impulsive wave (III) of a super cycle degree with the recent all-time high of 134.54 printed in April 2015 that confluences closely with a Fibonacci projection cluster (see weekly chart).
- Taking into account the above three mentioned elements; Apple is now facing the risk of a undergoing a potential multi-year bearish corrective wave (IV) phase. The previous corrective wave (II) lasted for three years that started from the peak of 5.37 seen in March 2000 (Dot.com bubble era) to April 2003 low of 0.91 (Iraq war 2 & SARS outbreak) that shed 83%
- The first major support rests at 92.00 which is the swing low formed after the last August 2015 sell-off that also coincides closely with the former swing high area of April 2012 and the recent swing low area of February 2016.
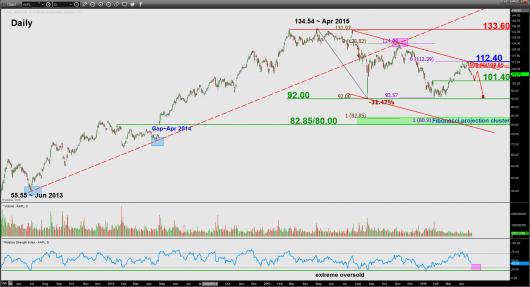
- As seen on the daily chart, Apple has been lacklustre price action as it continues to trace out a series of “lower highs” since the bearish breakdown of its former major trendline support from June 2013 low. Interestingly, last year rally from the August 2015 low has failed to make any advance above the pull-back resistance of the aforementioned former major trendline support (kissed and reversed down as highlighted by the pink shaded box).
- The major significant resistance now stands at 112.40 which is defined closely by the descending trendline a potential bearish channel from 20 July 2015 high and the swing high area of 15 April 2016.
- The lower boundary ( support) of the potential bearish channel stands at 82.85/80.00 which also confluences with the gap seen on April 2014 and a Fibonacci projection cluster.
- The daily (medium-term) RSI oscillator remains oriented to the downside and still has room to manoeuvre before reaching its extreme oversold level.
- The intermediate support rests at 101.40 before the major support of 92.00.
Key levels (1 to 3 months)
Intermediate resistance: 108.90/109.85 (gap)
Pivot (key resistance): 112.40
Supports: 101.40 & 92.00
Next resistance: 1336.60
Conclusion
Technical elements are bearish and the recent up move of 21% from its February 2016 low has appeared to have run its course and the downside motion that started from the current April 2015 all-time high of 134.54 is likely to continue.
We are taking things one step at a time. As long as the 112.40 pivotal resistance is not surpassed, Apple is likely to see a potential decline to test 101.40 before targeting the major support at 92.00. Only a clear break below (weekly close) 92.00 may trigger a deeper plunge towards the next support zone of 82.85/80.00.
On the other hand, a clearance above the 112.40 pivotal resistance is likely to damage the bearish expectations for a push back up to retest the February /April/July 2015 major range top at 133.60.
Charts are from eSignal
Disclaimer
This report is intended for general circulation only. It should not be construed as a recommendation, or an offer (or solicitation of an offer) to buy or sell any financial products. The information provided does not take into account your specific investment objectives, financial situation or particular needs. Before you act on any recommendation that may be contained in this email, independent advice ought to be sought from a financial adviser regarding the suitability of the investment product, taking into account your specific investment objectives, financial situation or particular needs. All queries regarding the contents of this material are to be directed to City Index, a trading name of GAIN Capital Singapore Pte Ltd.
Trading CFDs and FX on margin carries a high level of risk that may not be suitable for some investors. Consider your investment objectives, level of experience, financial resources, risk appetite and other relevant circumstances carefully. The possibility exists that you could lose some or all of your investments, including your initial deposits. If in doubt, please seek independent expert advice. Visit cityindex.com.sg for the complete Risk Disclosure Statement.
Related tags:




Open an account in minutes
Experience award-winning platforms with fast and secure execution, and enjoy tight spreads from 0.5 pts on FX and 0.3 pts on indices.
Economic calendar
Web Trader platform
Our sophisticated web-based platform is packed with features.
Related articles
This report is intended for general circulation only. It should not be construed as a recommendation, or an offer (or solicitation of an offer) to buy or sell any financial products. The information provided does not take into account your specific investment objectives, financial situation or particular needs. Before you act on any recommendation that may be contained in this report, independent advice ought to be sought from a financial adviser regarding the suitability of the investment product, taking into account your specific investment objectives, financial situation or particular needs.
StoneX Financial Pte. Ltd., may distribute reports produced by its respective foreign entities or affiliates within the StoneX group of companies or third parties pursuant to an arrangement under Regulation 32C of the Financial Advisers Regulations. Where the report is distributed to a person in Singapore who is not an accredited investor, expert investor or an institutional investor (as defined in the Securities Futures Act), StoneX Financial Pte. Ltd. accepts legal responsibility to such persons for the contents of the report only to the extent required by law. Singapore recipients should contact StoneX Financial Pte. Ltd. at 6826 9988 for matters arising from, or in connection with the report.
In the case of all other recipients of this report, to the extent permitted by applicable laws and regulations neither StoneX Financial Pte. Ltd. nor its associated companies will be responsible or liable for any loss or damage incurred arising out of, or in connection with, any use of the information contained in this report and all such liability is hereby expressly disclaimed. No representation or warranty is made, express or implied, that the content of this report is complete or accurate.
StoneX Financial Pte. Ltd. is not under any obligation to update this report.
Trading CFDs carries a high level of risk that may not be suitable for some investors. Consider your investment objectives, level of experience, financial resources, risk appetite and other relevant circumstances carefully. The possibility exists that you could lose some or all of your investments, including your initial deposits. If in doubt, please seek independent expert advice. Visit www.forex.com/en-sg/terms-and-policies for the complete Risk Disclosure Statement.