



The SP 500 Has Broken To the Downside of a ShortTerm Rectangle
Big companies reporting earnings this week include Costco, General Mills and Nike.
Share this:

On Tuesday, Nike (NKE) is awaited to post first quarter EPS of $0.42 compared to $0.86 a year ago on sales of $9.0 billion vs $10.7 billion last year. The Co designs and manufactures sportswear, and on September 9th, Bloomberg disclosed that the Co failed in an attempt to get the U.S. International Trade Commission to put an import ban on certain shoes from Skechers and New Balance on accusations of trademark infringement for it's Converse brand. Technically speaking, the RSI is above 50. The MACD is positive and below its signal line. The stock could retrace in the short term. Moreover, the stock is above its 20 and 50 day MA (respectively at $114.24 and $105.64). We are looking at the final target of $128.60 with a stop-loss set at $110.70.
On Wednesday, General Mills (GIS) is likely to unveil first quarter EPS of $0.87 vs $0.79 last year on revenue of $4.2 billion compared to $4.0 billion a year ago. The Co operates a global packaged food business and on September 15th, the Co announced the launch of its new ketogenic friendly product line ':ratio' in order to help consumers find ways to cut back on their carb and sugar intake. From a chartist's point of view, the RSI is trading below 30. This could mean that either the stock is in a lasting downtrend or just oversold and that therefore a rebound could shape (look for bullish divergence in this case). The MACD is below its signal line and negative. The configuration is negative. Moreover, the share stands below its 20 and 50 day MA (respectively at $61.5 and $63.08). We are looking at the final target of $52.90 with a stop-loss set at $60.00.
On Thursday, Costco Wholesale (COST) is expected to announce fourth quarter EPS of $2.82 compared to $2.69 a year ago on revenue of $52.1 billion vs 47.5 billion last year. The Co operates a chain of warehouse stores and its current analyst consensus rating is 20 buys, 14 holds and 2 sells, according to Bloomberg. In other news, on August 28th, the Co committed 25 million dollars to a new investment fund that will help fuel Black-led financial institutions and community development efforts. From a technical point of view, the RSI is below 50. The MACD is positive and below its signal line. The MACD must penetrate its zero line to expect further downside. Moreover, the share stands below its 20 and 50 day MA (respectively at $344.57 and $336.79). We are looking at the final target of $312.00 with a stop-loss set at $350.00.
Also on Thursday, CarMax (KMX) is anticipated to release second quarter EPS of $1.01 vs $1.40 last year on sales of $5.1 billion compared to $5.2 billion a year ago. The Co operates a car and light truck retail chain, and its stock price is anticipated to move up or down by 8.4% based on options volatility. The stock dropped 6.2% after they last reported earnings. Looking at a daily chart, the RSI is below 50. The MACD is below its signal line and positive. The MACD must penetrate its zero line to expect further downside. Moreover, the stock is below its 20 day MA ($105.69) but above its 50 day MA ($100.68). We are looking at the final target of $95.20 with a stop-loss set at $108.10.
Today, Etsy (ETSY), Catalent (CTLT) and Teradyne (TER) were added to the S&P 500 index, replacing H&R Block (HRB), Coty (COTY) and Kohl's (KSS).
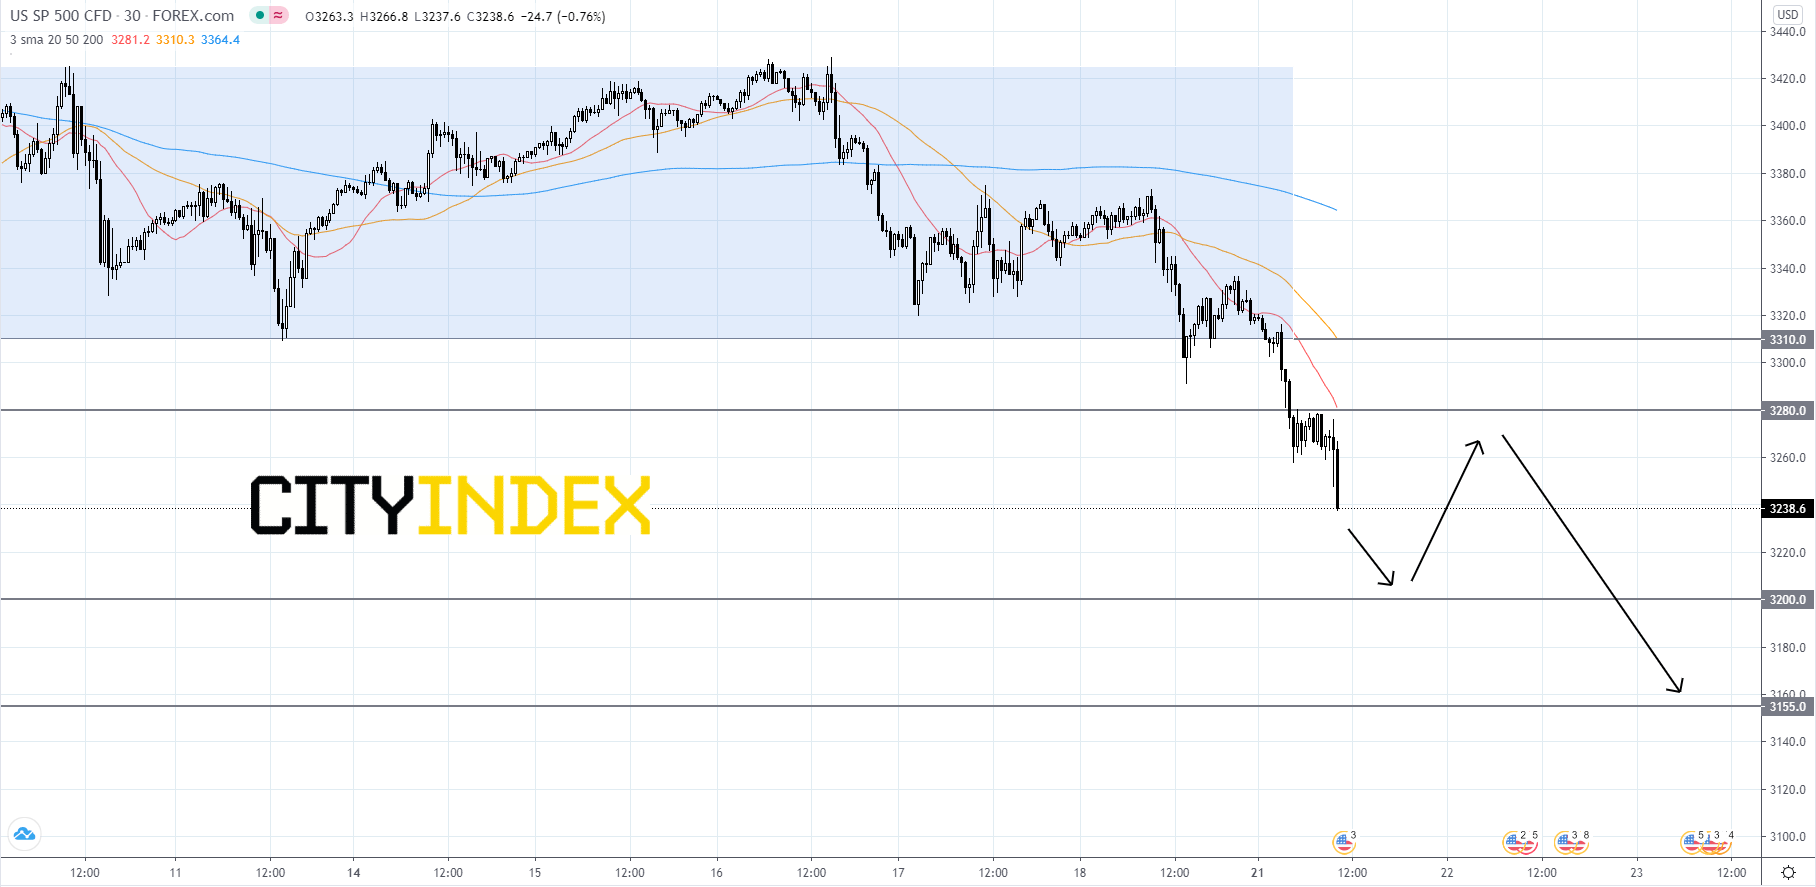
Looking at the S&P 500 CFD on a 30 minute chart, the index has broken out to the downside of a short-term rectangle pattern that price has been holding within since the second week of September. Price will likely continue downward and hit 3,200.00, a level last reached in late-July. The index could then bounce off of 3,200.00 and test its 3,280.00 resistance level, where price will probably halt before turning back down. Price will likely break below its 3,200.00 support level and fall further to 3,155.00. If price manages to get above 3,280.00 then it will mostly likely be stopped at 3,310.00. However, if price gets above 3,310.00, we could witness the index recover some ground and grind higher.
Source: GAIN Capital, TradingView
On Wednesday, General Mills (GIS) is likely to unveil first quarter EPS of $0.87 vs $0.79 last year on revenue of $4.2 billion compared to $4.0 billion a year ago. The Co operates a global packaged food business and on September 15th, the Co announced the launch of its new ketogenic friendly product line ':ratio' in order to help consumers find ways to cut back on their carb and sugar intake. From a chartist's point of view, the RSI is trading below 30. This could mean that either the stock is in a lasting downtrend or just oversold and that therefore a rebound could shape (look for bullish divergence in this case). The MACD is below its signal line and negative. The configuration is negative. Moreover, the share stands below its 20 and 50 day MA (respectively at $61.5 and $63.08). We are looking at the final target of $52.90 with a stop-loss set at $60.00.
On Thursday, Costco Wholesale (COST) is expected to announce fourth quarter EPS of $2.82 compared to $2.69 a year ago on revenue of $52.1 billion vs 47.5 billion last year. The Co operates a chain of warehouse stores and its current analyst consensus rating is 20 buys, 14 holds and 2 sells, according to Bloomberg. In other news, on August 28th, the Co committed 25 million dollars to a new investment fund that will help fuel Black-led financial institutions and community development efforts. From a technical point of view, the RSI is below 50. The MACD is positive and below its signal line. The MACD must penetrate its zero line to expect further downside. Moreover, the share stands below its 20 and 50 day MA (respectively at $344.57 and $336.79). We are looking at the final target of $312.00 with a stop-loss set at $350.00.
Also on Thursday, CarMax (KMX) is anticipated to release second quarter EPS of $1.01 vs $1.40 last year on sales of $5.1 billion compared to $5.2 billion a year ago. The Co operates a car and light truck retail chain, and its stock price is anticipated to move up or down by 8.4% based on options volatility. The stock dropped 6.2% after they last reported earnings. Looking at a daily chart, the RSI is below 50. The MACD is below its signal line and positive. The MACD must penetrate its zero line to expect further downside. Moreover, the stock is below its 20 day MA ($105.69) but above its 50 day MA ($100.68). We are looking at the final target of $95.20 with a stop-loss set at $108.10.
Today, Etsy (ETSY), Catalent (CTLT) and Teradyne (TER) were added to the S&P 500 index, replacing H&R Block (HRB), Coty (COTY) and Kohl's (KSS).
Looking at the S&P 500 CFD on a 30 minute chart, the index has broken out to the downside of a short-term rectangle pattern that price has been holding within since the second week of September. Price will likely continue downward and hit 3,200.00, a level last reached in late-July. The index could then bounce off of 3,200.00 and test its 3,280.00 resistance level, where price will probably halt before turning back down. Price will likely break below its 3,200.00 support level and fall further to 3,155.00. If price manages to get above 3,280.00 then it will mostly likely be stopped at 3,310.00. However, if price gets above 3,310.00, we could witness the index recover some ground and grind higher.
Source: GAIN Capital, TradingView
On Tuesday, Nike (NKE) is awaited to post first quarter EPS of $0.42 compared to $0.86 a year ago on sales of $9.0 billion vs $10.7 billion last year. The Co designs and manufactures sportswear, and on September 9th, Bloomberg disclosed that the Co failed in an attempt to get the U.S. International Trade Commission to put an import ban on certain shoes from Skechers and New Balance on accusations of trademark infringement for it's Converse brand. Technically speaking, the RSI is above 50. The MACD is positive and below its signal line. The stock could retrace in the short term. Moreover, the stock is above its 20 and 50 day MA (respectively at $114.24 and $105.64). We are looking at the final target of $128.60 with a stop-loss set at $110.70.
On Wednesday, General Mills (GIS) is likely to unveil first quarter EPS of $0.87 vs $0.79 last year on revenue of $4.2 billion compared to $4.0 billion a year ago. The Co operates a global packaged food business and on September 15th, the Co announced the launch of its new ketogenic friendly product line ':ratio' in order to help consumers find ways to cut back on their carb and sugar intake. From a chartist's point of view, the RSI is trading below 30. This could mean that either the stock is in a lasting downtrend or just oversold and that therefore a rebound could shape (look for bullish divergence in this case). The MACD is below its signal line and negative. The configuration is negative. Moreover, the share stands below its 20 and 50 day MA (respectively at $61.5 and $63.08). We are looking at the final target of $52.90 with a stop-loss set at $60.00.
On Thursday, Costco Wholesale (COST) is expected to announce fourth quarter EPS of $2.82 compared to $2.69 a year ago on revenue of $52.1 billion vs 47.5 billion last year. The Co operates a chain of warehouse stores and its current analyst consensus rating is 20 buys, 14 holds and 2 sells, according to Bloomberg. In other news, on August 28th, the Co committed 25 million dollars to a new investment fund that will help fuel Black-led financial institutions and community development efforts. From a technical point of view, the RSI is below 50. The MACD is positive and below its signal line. The MACD must penetrate its zero line to expect further downside. Moreover, the share stands below its 20 and 50 day MA (respectively at $344.57 and $336.79). We are looking at the final target of $312.00 with a stop-loss set at $350.00.
Also on Thursday, CarMax (KMX) is anticipated to release second quarter EPS of $1.01 vs $1.40 last year on sales of $5.1 billion compared to $5.2 billion a year ago. The Co operates a car and light truck retail chain, and its stock price is anticipated to move up or down by 8.4% based on options volatility. The stock dropped 6.2% after they last reported earnings. Looking at a daily chart, the RSI is below 50. The MACD is below its signal line and positive. The MACD must penetrate its zero line to expect further downside. Moreover, the stock is below its 20 day MA ($105.69) but above its 50 day MA ($100.68). We are looking at the final target of $95.20 with a stop-loss set at $108.10.
Today, Etsy (ETSY), Catalent (CTLT) and Teradyne (TER) were added to the S&P 500 index, replacing H&R Block (HRB), Coty (COTY) and Kohl's (KSS).
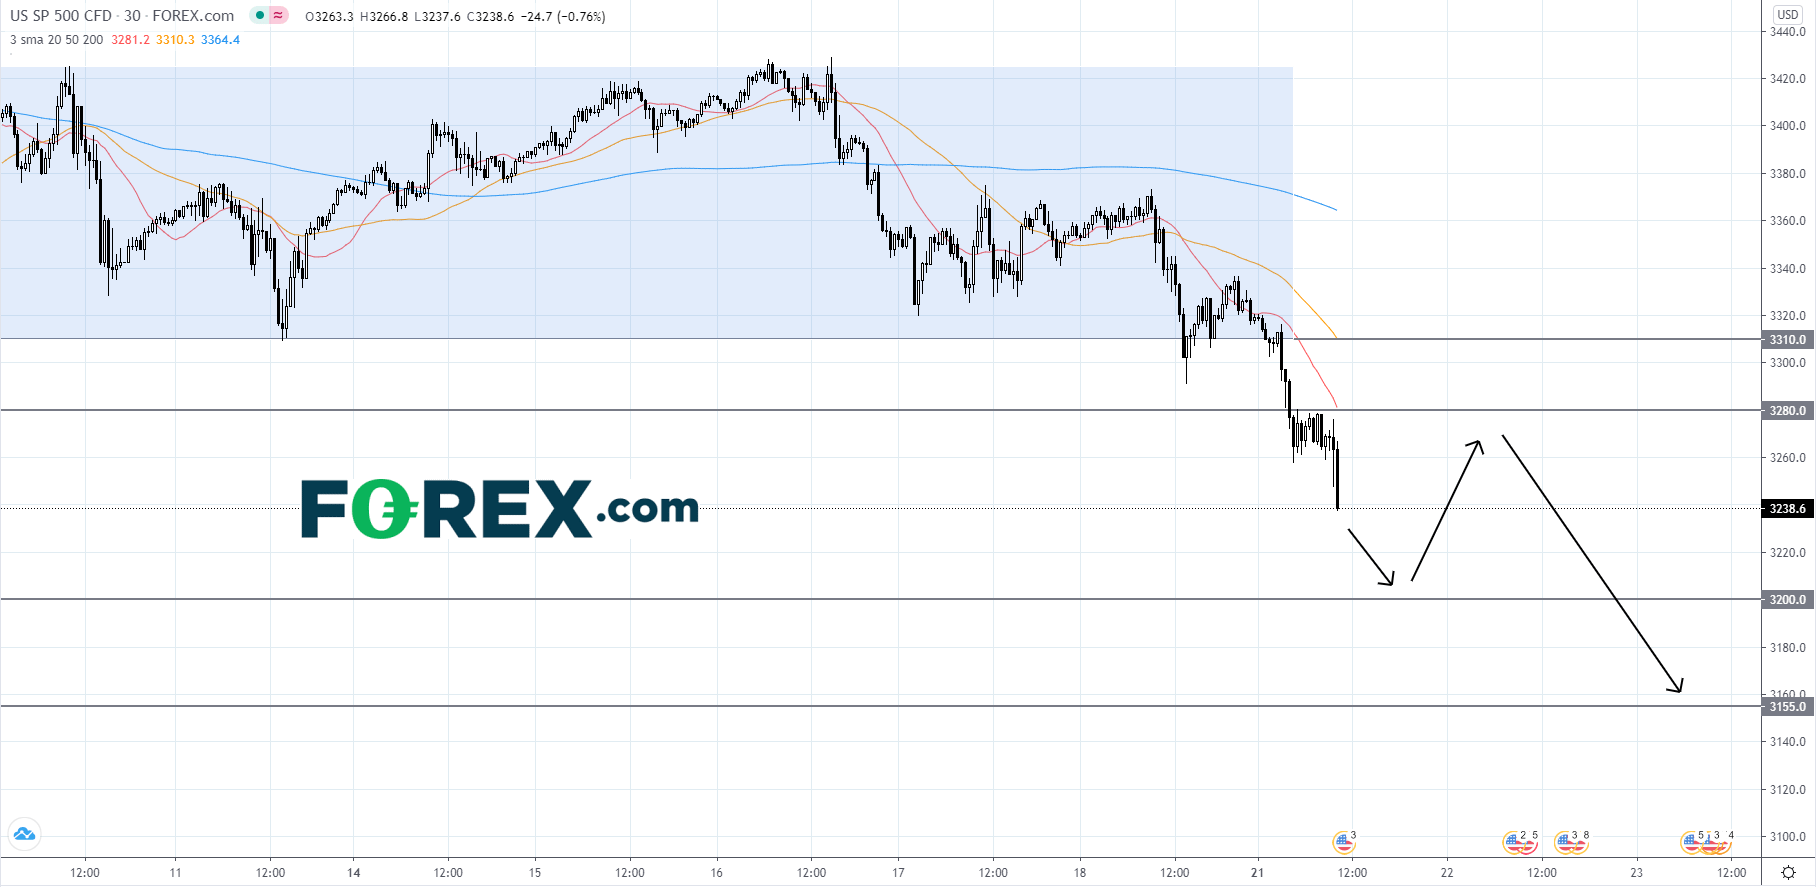
Looking at the S&P 500 CFD on a 30 minute chart, the index has broken out to the downside of a short-term rectangle pattern that price has been holding within since the second week of September. Price will likely continue downward and hit 3,200.00, a level last reached in late-July. The index could then bounce off of 3,200.00 and test its 3,280.00 resistance level, where price will probably halt before turning back down. Price will likely break below its 3,200.00 support level and fall further to 3,155.00. If price manages to get above 3,280.00 then it will mostly likely be stopped at 3,310.00. However, if price gets above 3,310.00, we could witness the index recover some ground and grind higher.
Source: GAIN Capital, TradingView
On Wednesday, General Mills (GIS) is likely to unveil first quarter EPS of $0.87 vs $0.79 last year on revenue of $4.2 billion compared to $4.0 billion a year ago. The Co operates a global packaged food business and on September 15th, the Co announced the launch of its new ketogenic friendly product line ':ratio' in order to help consumers find ways to cut back on their carb and sugar intake. From a chartist's point of view, the RSI is trading below 30. This could mean that either the stock is in a lasting downtrend or just oversold and that therefore a rebound could shape (look for bullish divergence in this case). The MACD is below its signal line and negative. The configuration is negative. Moreover, the share stands below its 20 and 50 day MA (respectively at $61.5 and $63.08). We are looking at the final target of $52.90 with a stop-loss set at $60.00.
On Thursday, Costco Wholesale (COST) is expected to announce fourth quarter EPS of $2.82 compared to $2.69 a year ago on revenue of $52.1 billion vs 47.5 billion last year. The Co operates a chain of warehouse stores and its current analyst consensus rating is 20 buys, 14 holds and 2 sells, according to Bloomberg. In other news, on August 28th, the Co committed 25 million dollars to a new investment fund that will help fuel Black-led financial institutions and community development efforts. From a technical point of view, the RSI is below 50. The MACD is positive and below its signal line. The MACD must penetrate its zero line to expect further downside. Moreover, the share stands below its 20 and 50 day MA (respectively at $344.57 and $336.79). We are looking at the final target of $312.00 with a stop-loss set at $350.00.
Also on Thursday, CarMax (KMX) is anticipated to release second quarter EPS of $1.01 vs $1.40 last year on sales of $5.1 billion compared to $5.2 billion a year ago. The Co operates a car and light truck retail chain, and its stock price is anticipated to move up or down by 8.4% based on options volatility. The stock dropped 6.2% after they last reported earnings. Looking at a daily chart, the RSI is below 50. The MACD is below its signal line and positive. The MACD must penetrate its zero line to expect further downside. Moreover, the stock is below its 20 day MA ($105.69) but above its 50 day MA ($100.68). We are looking at the final target of $95.20 with a stop-loss set at $108.10.
Today, Etsy (ETSY), Catalent (CTLT) and Teradyne (TER) were added to the S&P 500 index, replacing H&R Block (HRB), Coty (COTY) and Kohl's (KSS).
Looking at the S&P 500 CFD on a 30 minute chart, the index has broken out to the downside of a short-term rectangle pattern that price has been holding within since the second week of September. Price will likely continue downward and hit 3,200.00, a level last reached in late-July. The index could then bounce off of 3,200.00 and test its 3,280.00 resistance level, where price will probably halt before turning back down. Price will likely break below its 3,200.00 support level and fall further to 3,155.00. If price manages to get above 3,280.00 then it will mostly likely be stopped at 3,310.00. However, if price gets above 3,310.00, we could witness the index recover some ground and grind higher.
Source: GAIN Capital, TradingView
Related tags:


Open an account in minutes
Experience award-winning platforms with fast and secure execution, and enjoy tight spreads from 0.5 pts on FX and 0.3 pts on indices.
Economic calendar
Web Trader platform
Our sophisticated web-based platform is packed with features.
Related articles

USD/JPY outlook: Hawkish Fed recalibration pressures the yen
Stronger US growth momentum and rising Treasury yields are keeping USD/JPY pointed higher, even as Japanese policymakers try to limit the pressure building across domestic markets.


Gold, silver slammed as hawkish Fed repricing reignites dollar upside
Gold and silver had held up surprisingly well against surging US yields. Wednesday’s DXY breakout may have changed that equation.

Euro Short-term Outlook: EUR/USD Selloff Nears Critical Yearly Support 9 23 2026
Euro has fallen seven of the past nine sessions, with stretched momentum raising the stakes as EUR/USD closes in on a major inflection zone.

This report is intended for general circulation only. It should not be construed as a recommendation, or an offer (or solicitation of an offer) to buy or sell any financial products. The information provided does not take into account your specific investment objectives, financial situation or particular needs. Before you act on any recommendation that may be contained in this report, independent advice ought to be sought from a financial adviser regarding the suitability of the investment product, taking into account your specific investment objectives, financial situation or particular needs.
StoneX Financial Pte. Ltd., may distribute reports produced by its respective foreign entities or affiliates within the StoneX group of companies or third parties pursuant to an arrangement under Regulation 32C of the Financial Advisers Regulations. Where the report is distributed to a person in Singapore who is not an accredited investor, expert investor or an institutional investor (as defined in the Securities Futures Act), StoneX Financial Pte. Ltd. accepts legal responsibility to such persons for the contents of the report only to the extent required by law. Singapore recipients should contact StoneX Financial Pte. Ltd. at 6826 9988 for matters arising from, or in connection with the report.
In the case of all other recipients of this report, to the extent permitted by applicable laws and regulations neither StoneX Financial Pte. Ltd. nor its associated companies will be responsible or liable for any loss or damage incurred arising out of, or in connection with, any use of the information contained in this report and all such liability is hereby expressly disclaimed. No representation or warranty is made, express or implied, that the content of this report is complete or accurate.
StoneX Financial Pte. Ltd. is not under any obligation to update this report.
Trading CFDs carries a high level of risk that may not be suitable for some investors. Consider your investment objectives, level of experience, financial resources, risk appetite and other relevant circumstances carefully. The possibility exists that you could lose some or all of your investments, including your initial deposits. If in doubt, please seek independent expert advice. Visit www.forex.com/en-sg/terms-and-policies for the complete Risk Disclosure Statement.