





Tokyo State of Emergency due to Covid Where does Yen go from here USDJPY EURJPY
The MOF, BOJ, and Japan’s FSA met to ensure the stability of the Yen
Share this:

Japan has declared a second State of Emergency for Tokyo and 10 surrounding areas, which will last 1 month, amid a surge in coronavirus cases in the nation’s capital. Although Tokyo isn’t heading into full lockdown mode, the capital city has set curfews at restaurants and bars and will limit capacity at large events to 5,000 people. As a result, the Ministry of Finance, Bank of Japan, and Japan’s Financial Services Agency met to ensure the stability of the Yen and remind everyone that they are “vigilant” of exchange rates. This meeting helped cause a selloff in Yen pairs.
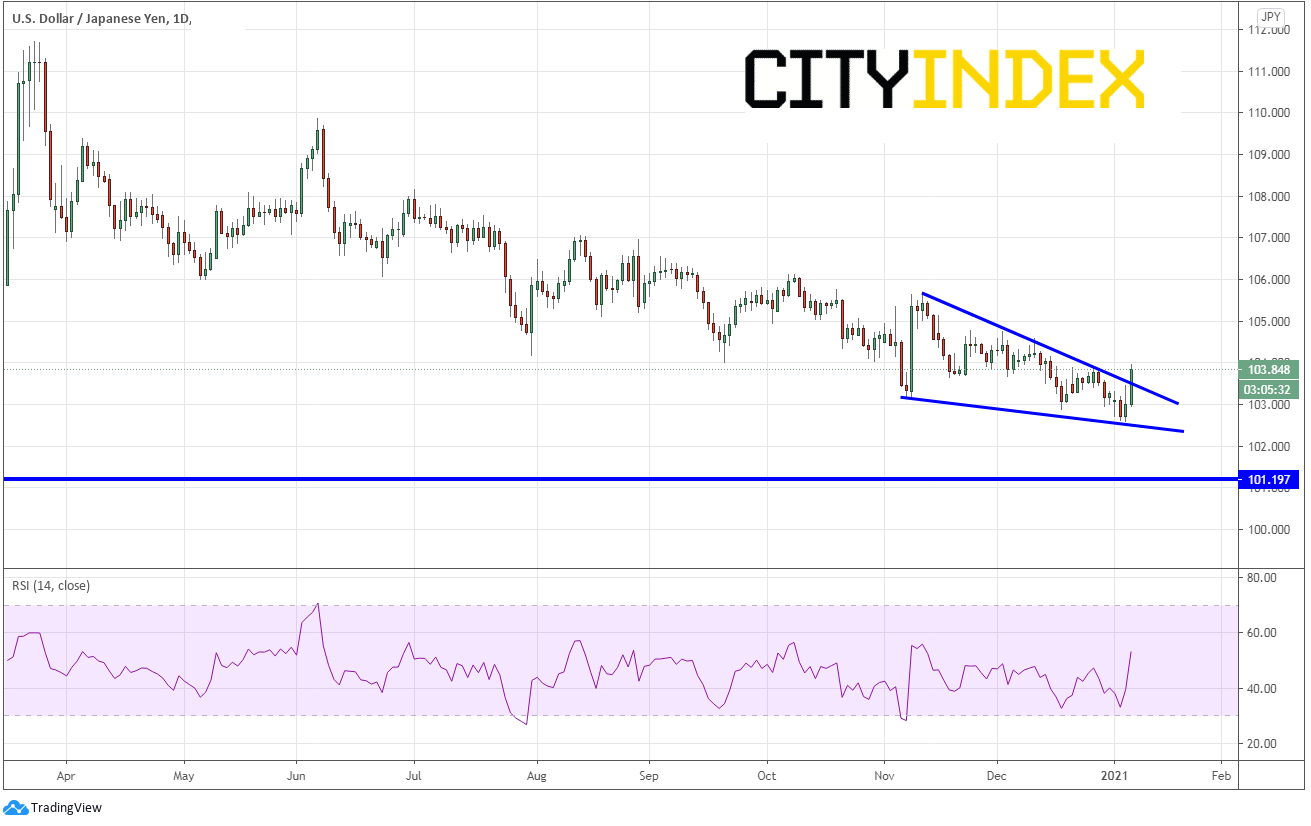
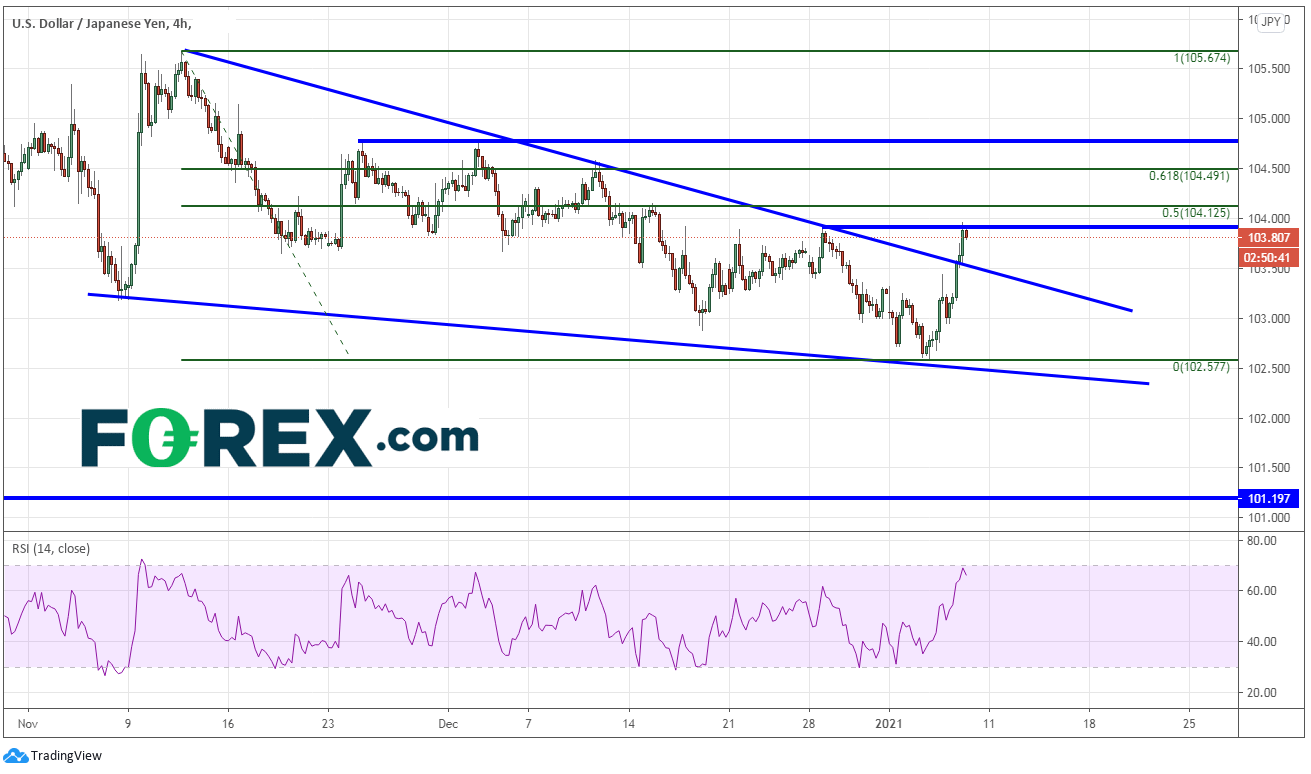
USD/JPY has been moving lower (Yen strengthening) since the pandemic highs in mid-March when it traded as high as 111.71. More recently, the pair has been trading in a descending wedge and traded as low as 102.59 yesterday. Today, USD/JPY broke higher through the downward sloping top trendline of the descending wedge.
Source: Tradingview, City Index
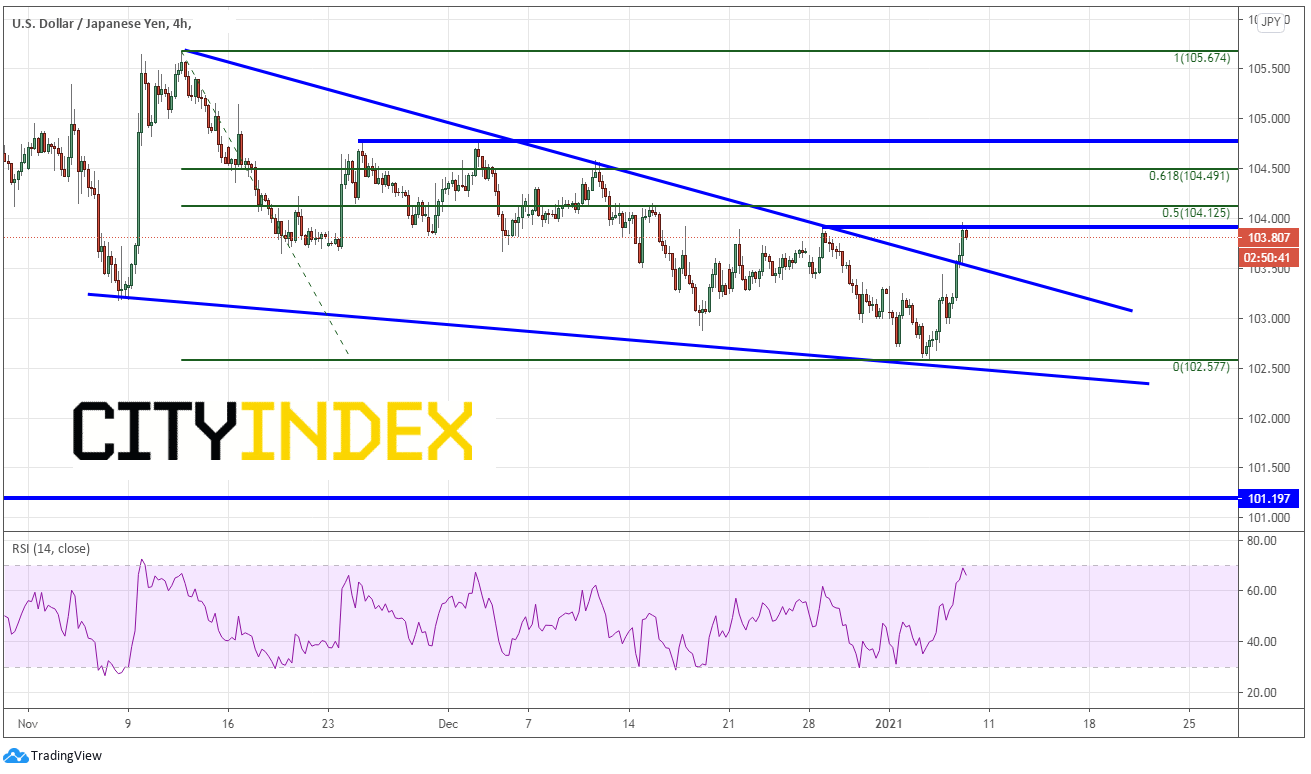
The target level on the breakout of a descending wedge is a 100% retracement of the wedge, or near 105.67. But USD/JPY has plenty of work to do to get back to that level. On a 240-minute timeframe, USD/JPY is banging up against horizontal resistance and prior highs from December 20th, 2020, near 103.85. Above there, resistance is at the 50% retracement level and the 61.8% Fibonacci retracement level from the March 24th, 2020 highs to the January 6th lows at 104.12 and 104.50, respectively. Watch for sellers to come in and try and push the pair lower near these levels. If higher prices can not be sustained, support is at the top trendline of the wedge near 103.50. Below there, price can fall back to January 6th lows near 102.59.
Source: Tradingview, City Index
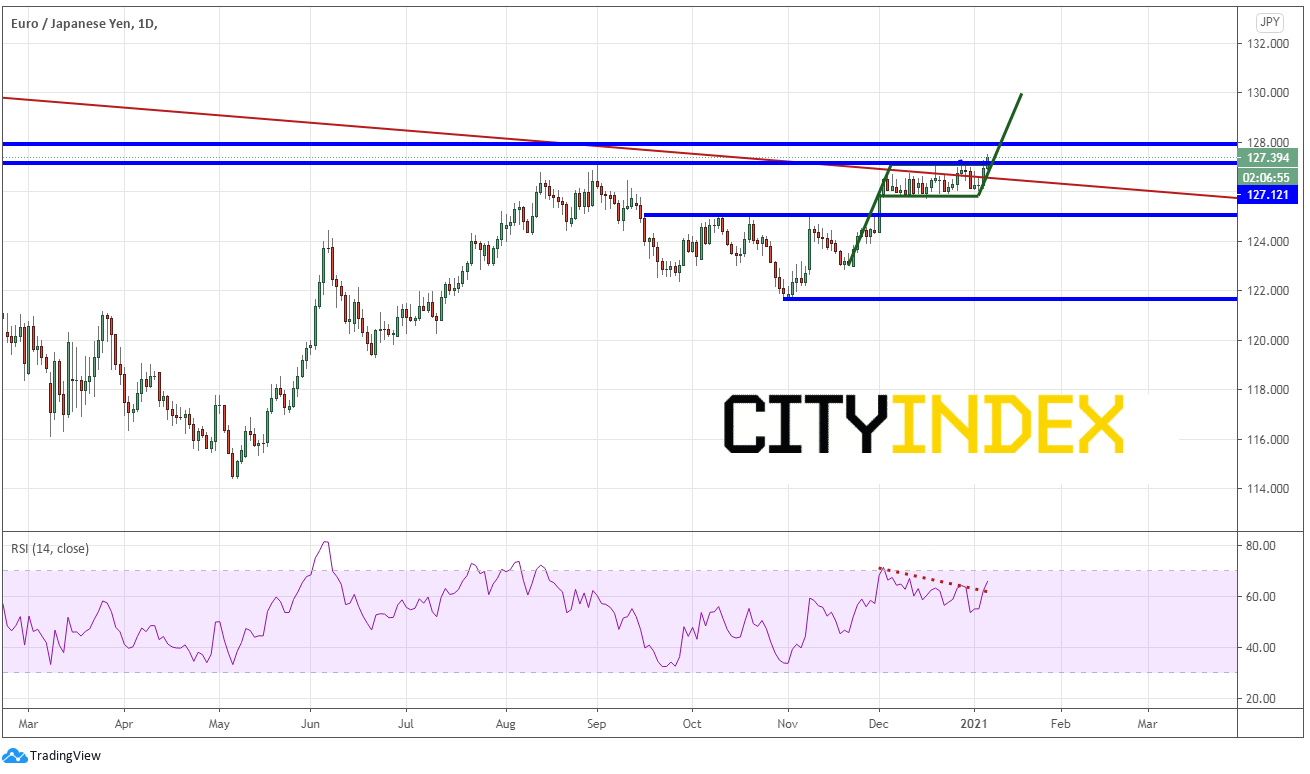
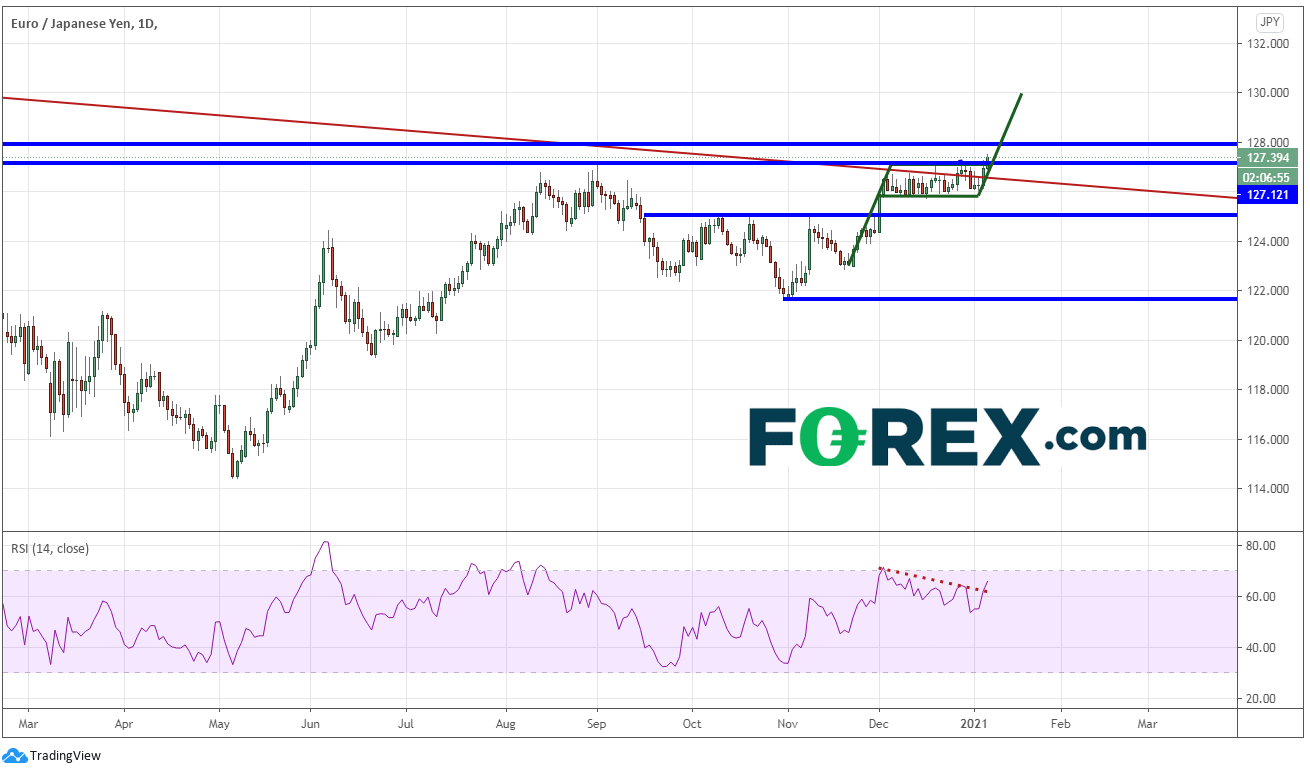
Contrary to USD/JPY, EUR/JPY has been moving higher off its lows since early May 2020, near 114.39. More recently, the pair has been forming a flag pattern and today, broke higher out of the flag and above long-term horizontal resistance at 127.25.
Source: Tradingview, City Index
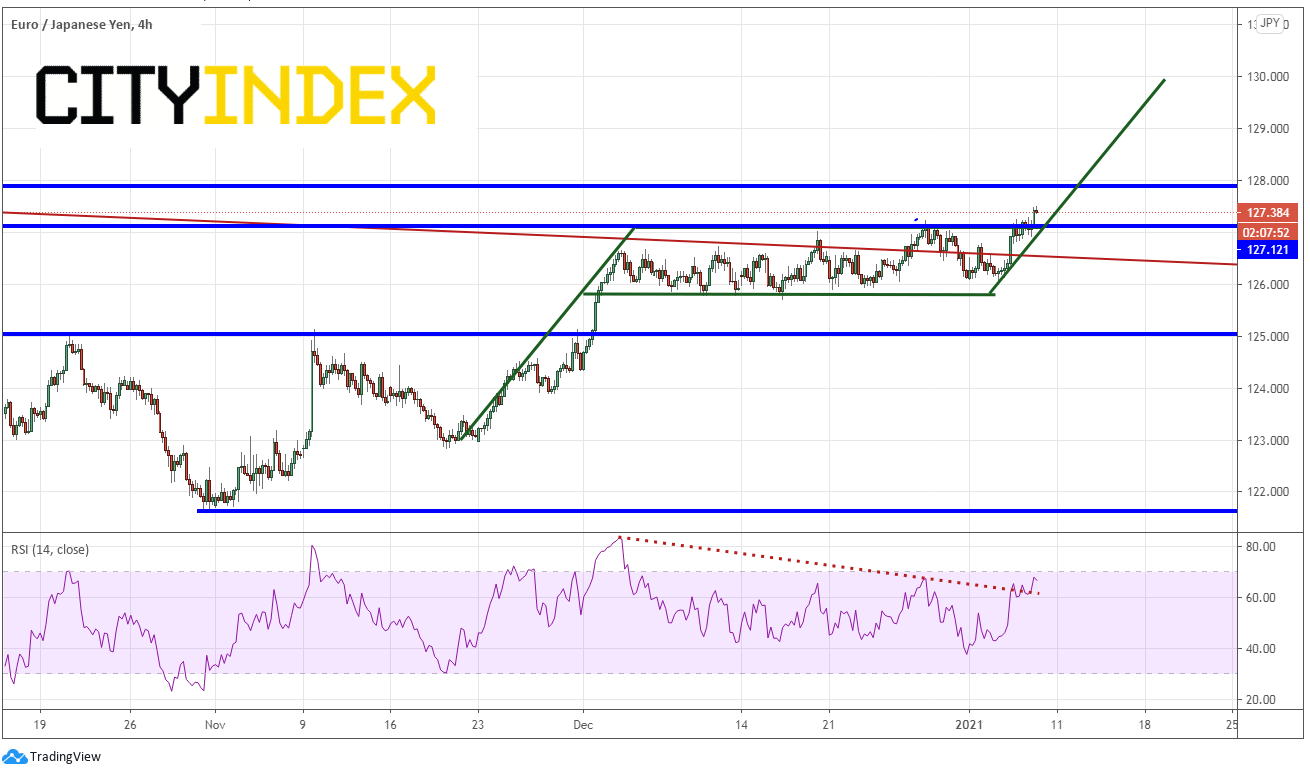
The target for the breakout of a flag is the length of the “pole” and add it to the breakout point of the flag. (The more conservative approach for a target is to measure the breakout point from the bottom trendline of the flag, as shown here.) In this case, the target is near 130.00. Horizontal resistance sits just above at 127.86. Support is at the breakout level near 127.25, then the bottom of the flag near 125.75. Below there is horizontal support near 125.12. Watch for buyers to enter on dips near any of these levels to add to long positions.
Source: Tradingview, City Index
If the coronavirus continues to spread in Japan, there will undoubtedly be additional measures taken by the government. If that is the case, watch for additional rhetoric by the BOJ, MOF, and government officials trying to talk down the value of the Yen!
Learn more about forex trading opportunities.
Japan has declared a second State of Emergency for Tokyo and 10 surrounding areas, which will last 1 month, amid a surge in coronavirus cases in the nation’s capital. Although Tokyo isn’t heading into full lockdown mode, the capital city has set curfews at restaurants and bars and will limit capacity at large events to 5,000 people. As a result, the Ministry of Finance, Bank of Japan, and Japan’s Financial Services Agency met to ensure the stability of the Yen and remind everyone that they are “vigilant” of exchange rates. This meeting helped cause a selloff in Yen pairs.
USD/JPY has been moving lower (Yen strengthening) since the pandemic highs in mid-March when it traded as high as 111.71. More recently, the pair has been trading in a descending wedge and traded as low as 102.59 yesterday. Today, USD/JPY broke higher through the downward sloping top trendline of the descending wedge.
Source: Tradingview, FOREX.com
The target level on the breakout of a descending wedge is a 100% retracement of the wedge, or near 105.67. But USD/JPY has plenty of work to do to get back to that level. On a 240-minute timeframe, USD/JPY is banging up against horizontal resistance and prior highs from December 20th, 2020, near 103.85. Above there, resistance is at the 50% retracement level and the 61.8% Fibonacci retracement level from the March 24th, 2020 highs to the January 6th lows at 104.12 and 104.50, respectively. Watch for sellers to come in and try and push the pair lower near these levels. If higher prices can not be sustained, support is at the top trendline of the wedge near 103.50. Below there, price can fall back to January 6th lows near 102.59.
Source: Tradingview, FOREX.com
Contrary to USD/JPY, EUR/JPY has been moving higher off its lows since early May 2020, near 114.39. More recently, the pair has been forming a flag pattern and today, broke higher out of the flag and above long-term horizontal resistance at 127.25.
Source: Tradingview, FOREX.com
The target for the breakout of a flag is the length of the “pole” and add it to the breakout point of the flag. (The more conservative approach for a target is to measure the breakout point from the bottom trendline of the flag, as shown here.) In this case, the target is near 130.00. Horizontal resistance sits just above at 127.86. Support is at the breakout level near 127.25, then the bottom of the flag near 125.75. Below there is horizontal support near 125.12. Watch for buyers to enter on dips near any of these levels to add to long positions.
Source: Tradingview, FOREX.com
If the coronavirus continues to spread in Japan, there will undoubtedly be additional measures taken by the government. If that is the case, watch for additional rhetoric by the BOJ, MOF, and government officials trying to talk down the value of the Yen!
Learn more about forex trading opportunities.
Latest market news




Open an account in minutes
Experience award-winning platforms with fast and secure execution, and enjoy tight spreads from 0.5 pts on FX and 0.3 pts on indices.
Economic calendar
Web Trader platform
Our sophisticated web-based platform is packed with features.
Related articles
Euro Short-term Outlook: EUR/USD Selloff Nears Critical Yearly Support 9 23 2026
Euro has fallen seven of the past nine sessions, with stretched momentum raising the stakes as EUR/USD closes in on a major inflection zone.

GBP/USD forecast: US dollar surges as bonds implode
The US dollar continued to press higher deep into the European session, supported by the slump in the bond markets as yields broke out across the curve. Following the recent hawkish Fed rate hike, yield spreads between the US and the rest of the world has continually increased, and that motion continued today, helped in part by some forecast-beating US macro data and hawkish Fed commentary.

Australian Dollar Technical Outlook: AUD/USD Breakdown Threatens Deeper Correction 9 23 2026
AUD/USD remains under pressure after breaking key trend support, with the latest decline putting the focus on the next major downside pivot.
This report is intended for general circulation only. It should not be construed as a recommendation, or an offer (or solicitation of an offer) to buy or sell any financial products. The information provided does not take into account your specific investment objectives, financial situation or particular needs. Before you act on any recommendation that may be contained in this report, independent advice ought to be sought from a financial adviser regarding the suitability of the investment product, taking into account your specific investment objectives, financial situation or particular needs.
StoneX Financial Pte. Ltd., may distribute reports produced by its respective foreign entities or affiliates within the StoneX group of companies or third parties pursuant to an arrangement under Regulation 32C of the Financial Advisers Regulations. Where the report is distributed to a person in Singapore who is not an accredited investor, expert investor or an institutional investor (as defined in the Securities Futures Act), StoneX Financial Pte. Ltd. accepts legal responsibility to such persons for the contents of the report only to the extent required by law. Singapore recipients should contact StoneX Financial Pte. Ltd. at 6826 9988 for matters arising from, or in connection with the report.
In the case of all other recipients of this report, to the extent permitted by applicable laws and regulations neither StoneX Financial Pte. Ltd. nor its associated companies will be responsible or liable for any loss or damage incurred arising out of, or in connection with, any use of the information contained in this report and all such liability is hereby expressly disclaimed. No representation or warranty is made, express or implied, that the content of this report is complete or accurate.
StoneX Financial Pte. Ltd. is not under any obligation to update this report.
Trading CFDs carries a high level of risk that may not be suitable for some investors. Consider your investment objectives, level of experience, financial resources, risk appetite and other relevant circumstances carefully. The possibility exists that you could lose some or all of your investments, including your initial deposits. If in doubt, please seek independent expert advice. Visit www.forex.com/en-sg/terms-and-policies for the complete Risk Disclosure Statement.