





Two trades to watch Gold WTI US crude oil
Gold ahead of US core PCE inflation data. WTI remains supported by reopening optimism, Baker Hughes rig count in focus.
Share this:

Gold ahead of Core PCE Inflation data
Annual PCE price index, the Fed’s preferred gauge of inflation is expected to rise to 2.9% in April up from 1.8% in March.
The data comes as inflation concerns have stalked the market particularly since the Consumer Price Index inflation data jumped to 4.2% in April from 2.6% in March. Following the data the US Dollar jumped 0.7%.
A strong PCE print could fuel concerns that the Fed will look to move early on interest rates, boost treasury yields.
Gold is a hedge against inflation but is non yielding so is extremely sensitive to treasury bond yields.
Where next for Gold prices?
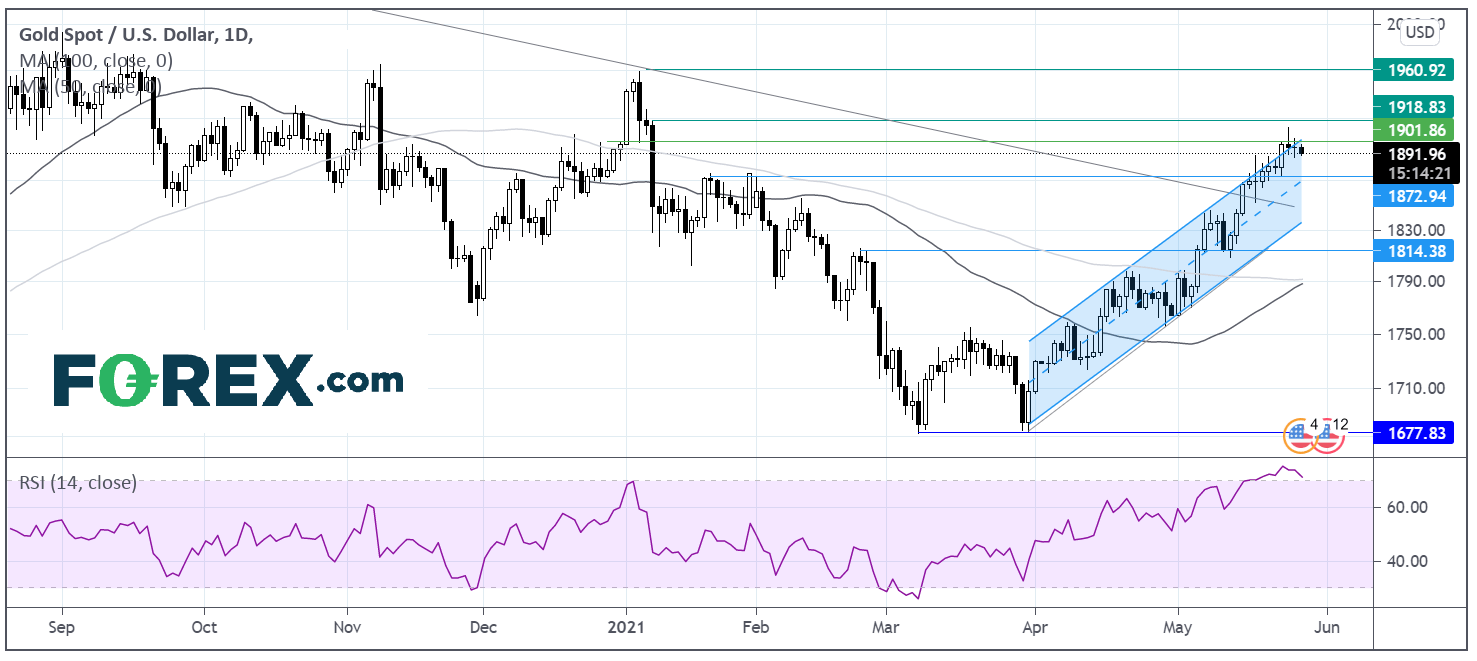
Gold broke out above its ascending channel hitting a fresh 4 month high of $1912 on Wednesday. The price has just eased back slightly back under $1900 and back into the ascending channel.
The RSI shows is in overbought territory suggesting that that any decline resulting from a strong Core PCE reading is likely to be more severe than the upside stemming from a weaker inflation print.
Given that gold is up over 7% so far this month, it could in fact be seen as an opportunity to book profits.
Resistance is seen at $1900 round number ahead of $1912 the weekly high.
A move below $1870 horizontal support could negate the current near term uptrend.
WTI support by US data, Baker Hughes rig count in focus
Oil prices are pushing higher following from strong US data in the previous session as jobless claims hit a 14 month low.
Expectations of a strong economic recovery are lifting demand expectations for Q3.
There is a growing belief that if the 2015 Iran nuclear deal is revived sanction won’t be lifted immediately and oil will only be returned to the market gradually.
OPEC+ are expected to stick to the plan of gradually raising output when the meet on Monday, underpinning the market mood.
Baker Hughes rig count due later today.
Where next for crude oil?
Oil trades above its ascending trendline dating back to mid March. It trades above its 50 & 100 sma on the daily chart showing an established bullish trend.
After hitting a high of 67.67 in March the price has failed to form a higher high above that level.
Bulls have been hovering around this level for 3 months. The RSI is supportive of further upside above the 50 level but out of overbought territory.
Bulls need to break above 67.67 in order to head towards $70 round number and psychological level.
It would take a move below 63.00 to negate the current uptrend.
How to trade with FOREX.com
Follow these easy steps to start trading with FOREX.com today:
- Open a Forex.com account, or log-in if you’re already a customer.
- Search for the market you want to trade in our award-winning platform.
- Choose your position and size, and your stop and limit levels.
- Place the trade.
Gold ahead of Core PCE Inflation data
Annual PCE price index, the Fed’s preferred gauge of inflation is expected to rise to 2.9% in April up from 1.8% in March.
The data comes as inflation concerns have stalked the market particularly since the Consumer Price Index inflation data jumped to 4.2% in April from 2.6% in March. Following the data the US Dollar jumped 0.7%.
A strong PCE print could fuel concerns that the Fed will look to move early on interest rates, boost treasury yields.
Gold is a hedge against inflation but is non yielding so is extremely sensitive to treasury bond yields.
Where next for Gold prices?
Gold broke out above its ascending channel hitting a fresh 4 month high of $1912 on Wednesday. The price has just eased back slightly back under $1900 and back into the ascending channel.
The RSI shows is in overbought territory suggesting that that any decline resulting from a strong Core PCE reading is likely to be more severe than the upside stemming from a weaker inflation print.
Given that gold is up over 7% so far this month, it could in fact be seen as an opportunity to book profits.
Resistance is seen at $1900 round number ahead of $1912 the weekly high.
A move below $1870 horizontal support could negate the current near term uptrend.
Learn more about trading gold
WTI support by US data, Baker Hughes rig count in focus
Oil prices are pushing higher following from strong US data in the previous session as jobless claims hit a 14 month low.
Expectations of a strong economic recovery are lifting demand expectations for Q3.
There is a growing belief that if the 2015 Iran nuclear deal is revived sanction won’t be lifted immediately and oil will only be returned to the market gradually.
OPEC+ are expected to stick to the plan of gradually raising output when the meet on Monday, underpinning the market mood.
Baker Hughes rig count due later today.
Where next for crude oil?
Oil trades above its ascending trendline dating back to mid March. It trades above its 50 & 100 sma on the daily chart showing an established bullish trend.
After hitting a high of 67.67 in March the price has failed to form a higher high above that level.
Bulls have been hovering around this level for 3 months. The RSI is supportive of further upside above the 50 level but out of overbought territory.
Bulls need to break above 67.67 in order to head towards $70 round number and psychological level.
It would take a move below 63.00 to negate the current uptrend.
How to trade with City Index
Follow these easy steps to start trading with City Index today:
- Open a City Index account, or log-in if you’re already a customer.
- Search for the market you want to trade in our award-winning platform.
- Choose your position and size, and your stop and limit levels.
- Place the trade.


Open an account in minutes
Experience award-winning platforms with fast and secure execution, and enjoy tight spreads from 0.5 pts on FX and 0.3 pts on indices.
Economic calendar
Web Trader platform
Our sophisticated web-based platform is packed with features.
Related articles

Why Crude Oil Slid While Middle East Tensions Kept Building
The crude oil pullback from monthly highs is running ahead of the headlines, as WTI and Brent ease while Middle East tensions stay unresolved.

EUR/USD, Gold Forecast: Two trades to watch
EUR/USD falls to a 2-month low despite Eurozone growth picking up. Gold under pressure as a stronger USD offsets falling oil prices.

Crude and dollar rebound as Trump says deal possible after the election
Donald Trump’s speech at the UN seems to have poured cold waters on any hopes of a deal. Crude oil, the US dollar and bond yields all bounced back from their lows, causing fresh pressure on foreign currencies, European indices and to a lesser degree precious metals.

This report is intended for general circulation only. It should not be construed as a recommendation, or an offer (or solicitation of an offer) to buy or sell any financial products. The information provided does not take into account your specific investment objectives, financial situation or particular needs. Before you act on any recommendation that may be contained in this report, independent advice ought to be sought from a financial adviser regarding the suitability of the investment product, taking into account your specific investment objectives, financial situation or particular needs.
StoneX Financial Pte. Ltd., may distribute reports produced by its respective foreign entities or affiliates within the StoneX group of companies or third parties pursuant to an arrangement under Regulation 32C of the Financial Advisers Regulations. Where the report is distributed to a person in Singapore who is not an accredited investor, expert investor or an institutional investor (as defined in the Securities Futures Act), StoneX Financial Pte. Ltd. accepts legal responsibility to such persons for the contents of the report only to the extent required by law. Singapore recipients should contact StoneX Financial Pte. Ltd. at 6826 9988 for matters arising from, or in connection with the report.
In the case of all other recipients of this report, to the extent permitted by applicable laws and regulations neither StoneX Financial Pte. Ltd. nor its associated companies will be responsible or liable for any loss or damage incurred arising out of, or in connection with, any use of the information contained in this report and all such liability is hereby expressly disclaimed. No representation or warranty is made, express or implied, that the content of this report is complete or accurate.
StoneX Financial Pte. Ltd. is not under any obligation to update this report.
Trading CFDs carries a high level of risk that may not be suitable for some investors. Consider your investment objectives, level of experience, financial resources, risk appetite and other relevant circumstances carefully. The possibility exists that you could lose some or all of your investments, including your initial deposits. If in doubt, please seek independent expert advice. Visit www.forex.com/en-sg/terms-and-policies for the complete Risk Disclosure Statement.