



Two trades to watch: USD/JPY, GBP/USD
USD/JPY falls in risk off trade, post BoJ minutes. GBP/USD falls on dismal retail sales.
Share this:

USD/JPY falls in risk off trade
USD/JPY is heading lower for a third straight session. Risk off trade is boosting demand for the safe haven yen in addition to a tick higher in Japanese inflation to 0.8% YoY in December, up from 0.6%.
The minutes from the latest BoJ meeting also showed that policymakers saw upward price pressures building.
Risk off sentiment on Fed fears and mixed earnings boosted demand for US bonds, pulling yields and the USD lower.
There is no high impacting US data due later.
Where next for the USD/JPY?
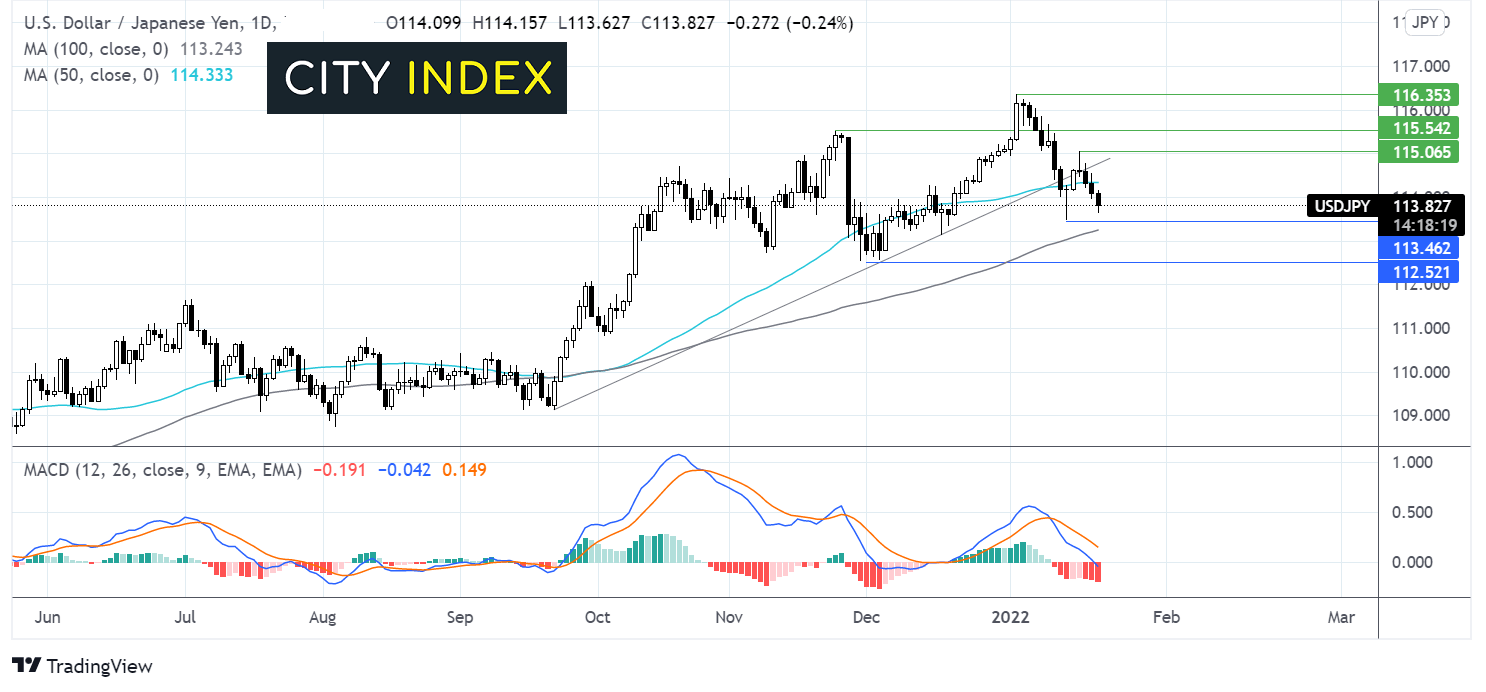
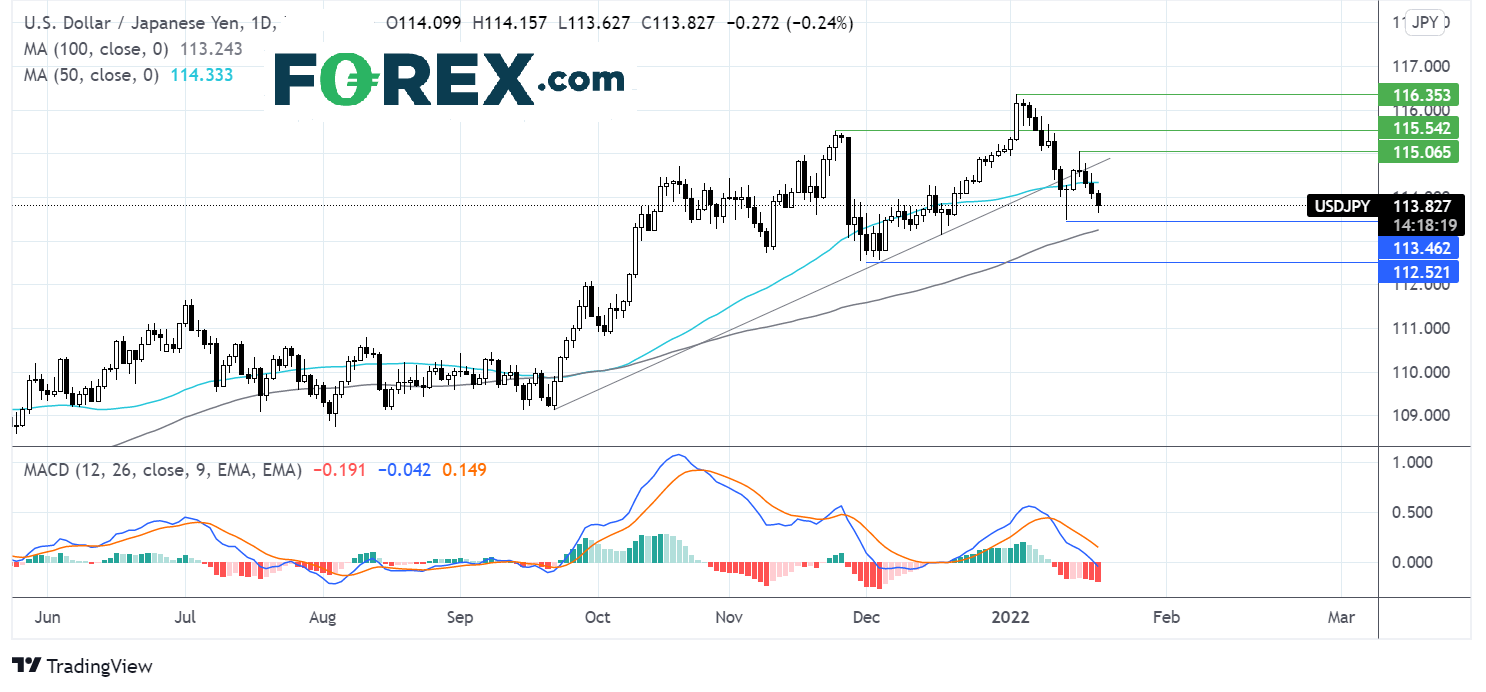
USD/JPY has trended lower for three straight days. A break below the multi-month rising trendline and 50 sma, combined with the bearish MACD suggests that there could be more downside to come.
A break below 113.45 the 2022 low could open the door to the 100 sma at 113.25 and 112.50 the December low.
Buyers will be looking to retake the 50 sma at 114.34. A move above 115.06, the weekly high, could see bulls gain momentum.
GBP/USD falls on dismal retail sales
UK retail sales fell -3.7% MoM in December missing forecasts of -0.6% and a significant fall from November’s 1% rise.
Retail sales suffered the biggest decline since January last year, as shopper stayed at home whilst Omicron cases surged. Whilst UK retailers may recoup this loss in the first Q1 of 2022, its worth keeping in mind that the cost of living is also expected to rise over those months
Consumer confidence also dropped in January to -19 from -16 as inflation fears hit households and could see consumers rein in discretionary spending.
The US dollar trades under pressure as safe haven trade to boosting demand for bonds, sending treasury yields lower.
Where next for GBP/USD?
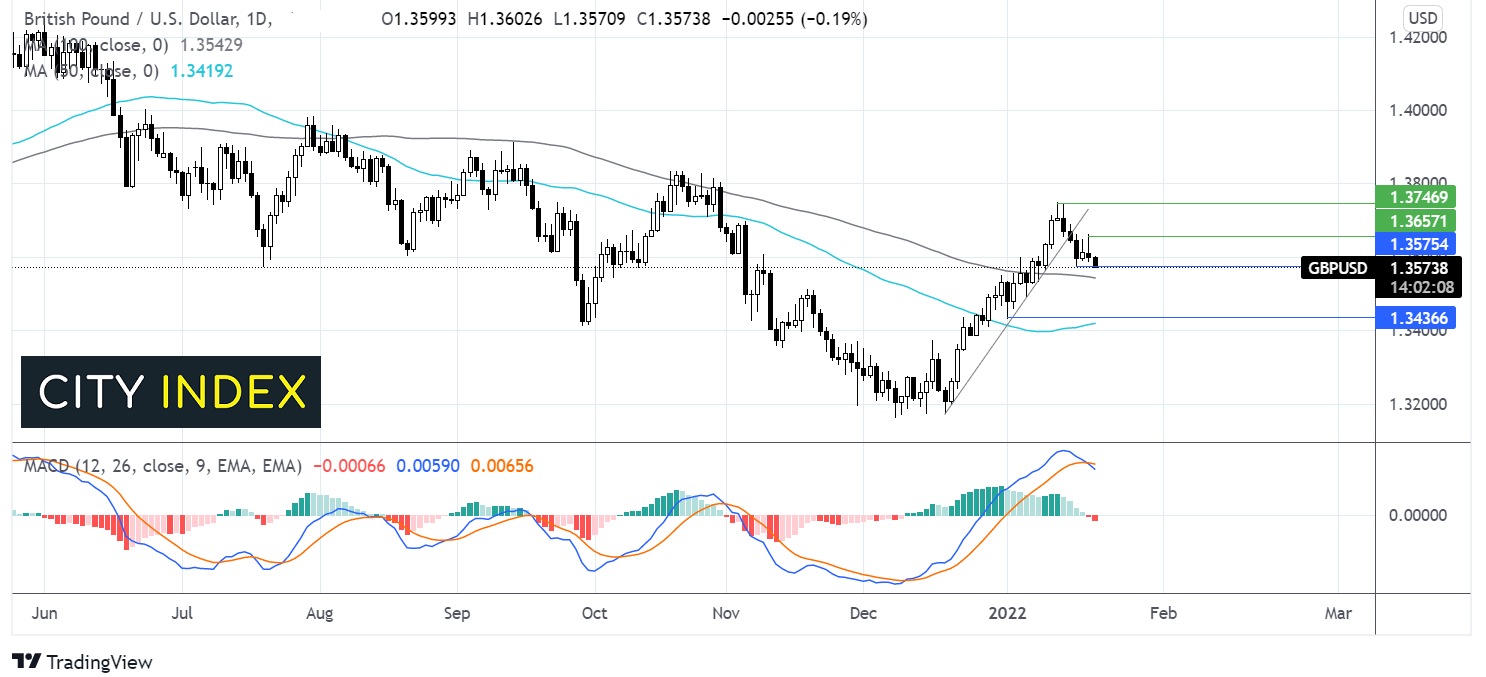
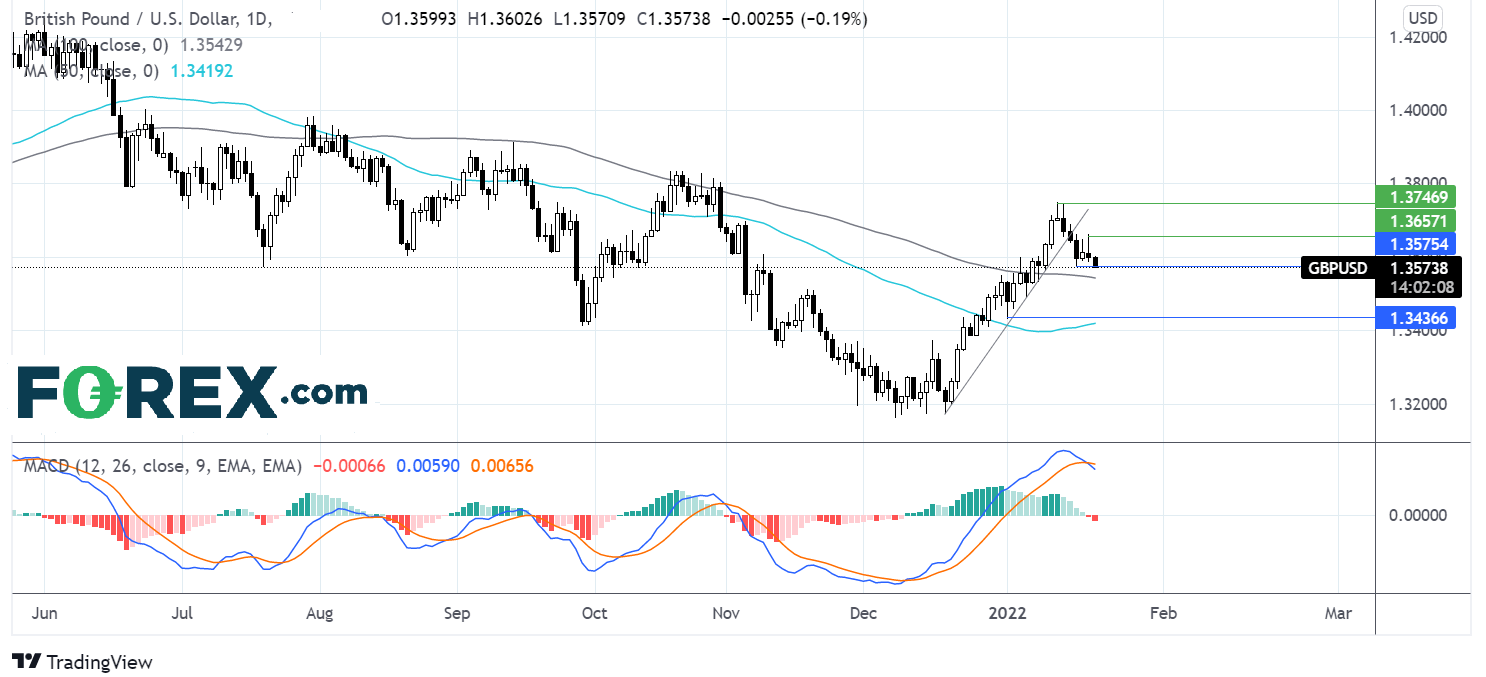
GBPUSD fell below its month old rising trendline which combined with the bearish crossover on the MACD points to further declines.
Sellers are testing the weekly low at 1.3570. A break below here exposes the 100 sma at 1.3540 and the January low at 1.3435.
Should the support hold, buyers could look for a move over 1.3660 the weekly high in order to open the door to 1.3750 the 2022 high.
How to trade with City Index
Follow these easy steps to start trading with City Index today:
- Open a City Index account, or log-in if you’re already a customer.
- Search for the market you want to trade in our award-winning platform.
- Choose your position and size, and your stop and limit levels
- Place the trade.
Related tags:



Open an account in minutes
Experience award-winning platforms with fast and secure execution, and enjoy tight spreads from 0.5 pts on FX and 0.3 pts on indices.
Economic calendar
Web Trader platform
Our sophisticated web-based platform is packed with features.
Related articles
British Pound Technical Outlook: GBP/USD Rebound Challenges September Downtrend 9 30 2026
Sterling has rallied sharply from key support, with GBP/USD at an inflection point that could determine whether a larger recovery is underway.

EUR/USD forecast: Eurozone stagflation risks mount as dollar holds firm ahead of data
The dollar was bouncing back at the time of writing, after it had eased overnight on the back of some weaker-than-expected economic data yesterday which had prompted markets to scale back expectations of an October Fed rate hike. However, with more significant US data due today and Friday, and with oil prices continuing to remain elevated, the dollar’s broader direction remains bullish.


NZD/USD pressure mounts as payrolls looms large
NZD/USD has fallen sharply as Fed rate expectations reset higher, but extreme downside stretch and major support raise the risk of a violent counter-trend rebound.

This report is intended for general circulation only. It should not be construed as a recommendation, or an offer (or solicitation of an offer) to buy or sell any financial products. The information provided does not take into account your specific investment objectives, financial situation or particular needs. Before you act on any recommendation that may be contained in this report, independent advice ought to be sought from a financial adviser regarding the suitability of the investment product, taking into account your specific investment objectives, financial situation or particular needs.
StoneX Financial Pte. Ltd., may distribute reports produced by its respective foreign entities or affiliates within the StoneX group of companies or third parties pursuant to an arrangement under Regulation 32C of the Financial Advisers Regulations. Where the report is distributed to a person in Singapore who is not an accredited investor, expert investor or an institutional investor (as defined in the Securities Futures Act), StoneX Financial Pte. Ltd. accepts legal responsibility to such persons for the contents of the report only to the extent required by law. Singapore recipients should contact StoneX Financial Pte. Ltd. at 6826 9988 for matters arising from, or in connection with the report.
In the case of all other recipients of this report, to the extent permitted by applicable laws and regulations neither StoneX Financial Pte. Ltd. nor its associated companies will be responsible or liable for any loss or damage incurred arising out of, or in connection with, any use of the information contained in this report and all such liability is hereby expressly disclaimed. No representation or warranty is made, express or implied, that the content of this report is complete or accurate.
StoneX Financial Pte. Ltd. is not under any obligation to update this report.
Trading CFDs carries a high level of risk that may not be suitable for some investors. Consider your investment objectives, level of experience, financial resources, risk appetite and other relevant circumstances carefully. The possibility exists that you could lose some or all of your investments, including your initial deposits. If in doubt, please seek independent expert advice. Visit www.forex.com/en-sg/terms-and-policies for the complete Risk Disclosure Statement.