



USD into Inflation Week: Oil, EUR/USD, USD/JPY
This week brings inflation data out of the U.S. and we’ll probably start to see the initial impact of higher oil prices. Markets are continuing to show hope as stocks have remained strong and USD weak even as Oil prices have continued to scale higher.
Share this:

It’s a big week for US data as we get U.S. inflation data that will probably start to show the initial impacts of higher oil prices. Core PCE is released on Thursday and then CPI a day later, with headline CPI expected to have jumped to 3.3% from last month’s 2.4% print. Core PCE was already elevated last month at 3.1% but that didn’t seem to deter expectations for rate cuts, although the jump in oil prices over the past month has pushed expectations for the bank to hold flat into the end of the year.
FOMC Expectations into End of 2026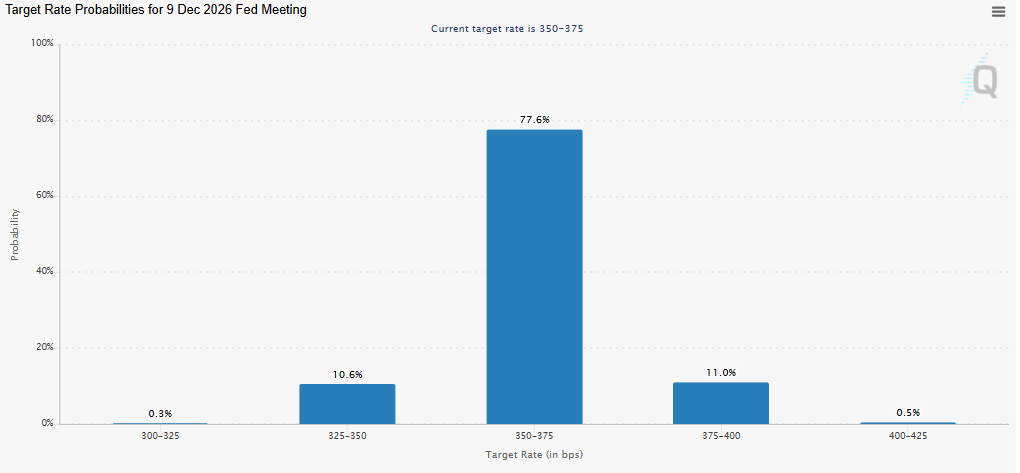
Chart prepared by James Stanley; data derived from Tradingview
Oil as the Push Point
While the US Dollar was positively correlated with oil prices in early-March as both markets broke out, that correlation has begun to diverge recently, especially over the past week.
US Oil prices are still showing strength and more acceptance above the $100 level. But the USD on the other hand hasn’t been able to run with breakouts although the bullish backdrop remains given the ascending triangle formation on the daily chart.
US Oil (WTI) Four-Hour Price Chart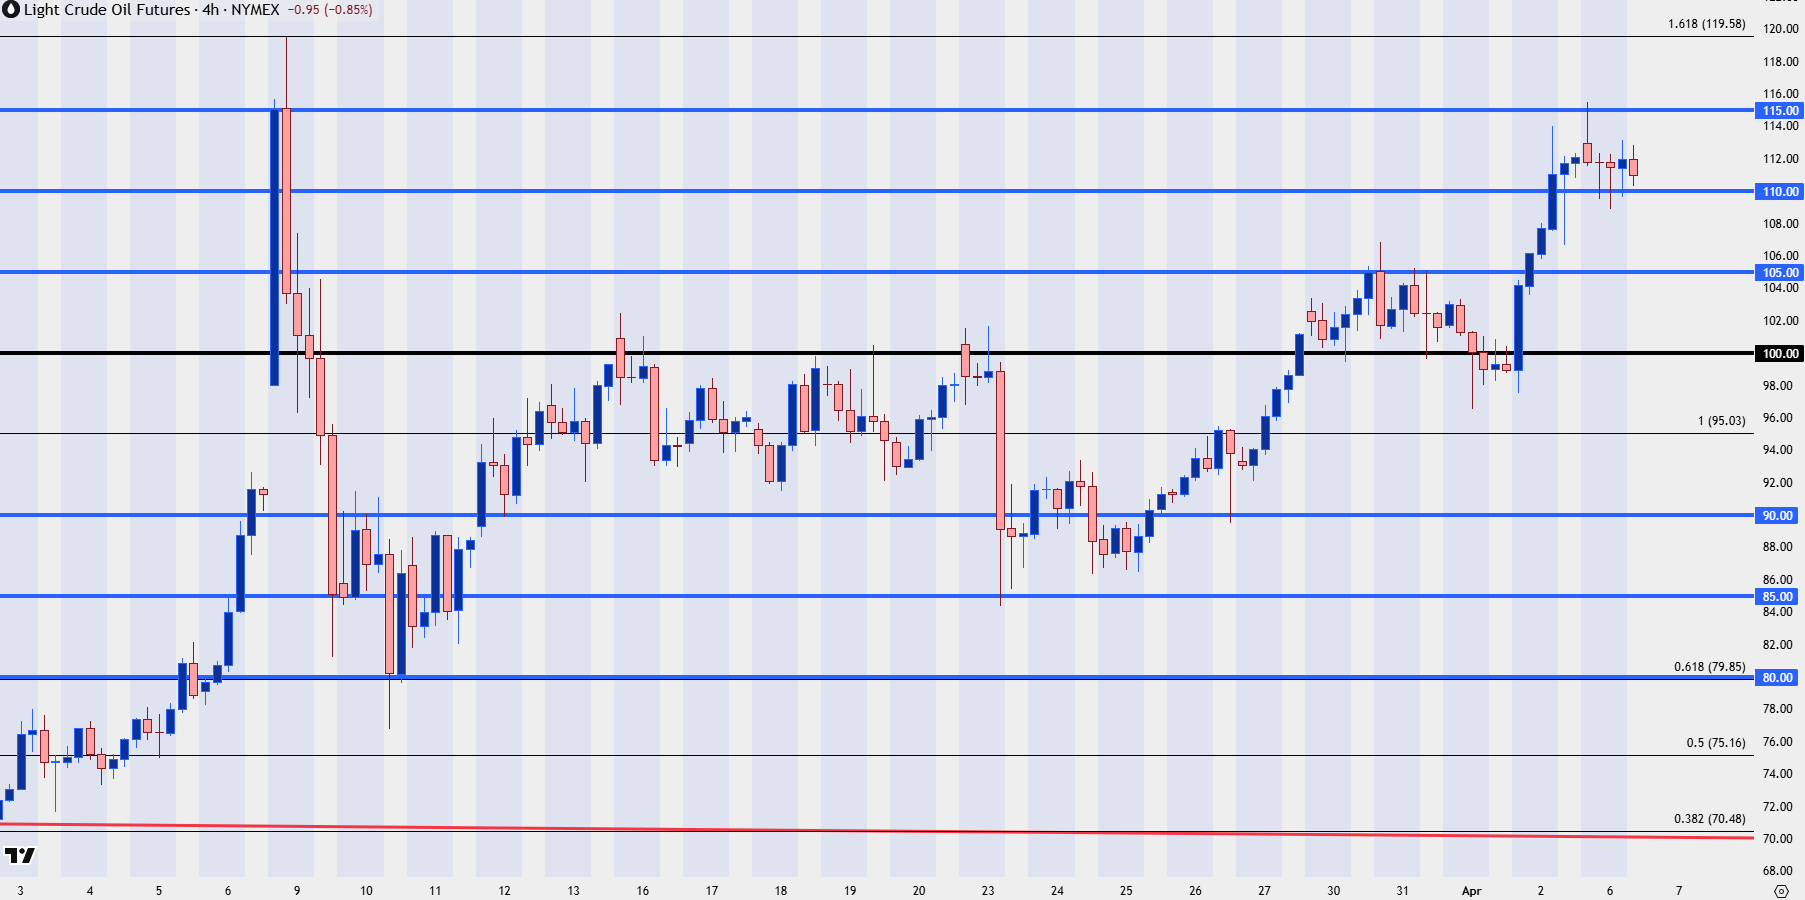
Chart prepared by James Stanley; data derived from Tradingview
USD
I think the Japanese Yen situation is still the big push point in the USD, and if we are going to see the Dollar break down it’ll likely need some help from Japanese government officials in the form of an intervention, as USD/JPY is tip-toeing close and closer to a 160.00 breakout.
From the daily chart, bulls still have a shot in DXY as there’s an ascending triangle formation, very similar to the backdrop that had built in February ahead of the breakout to begin March.
US Dollar Daily Price Chart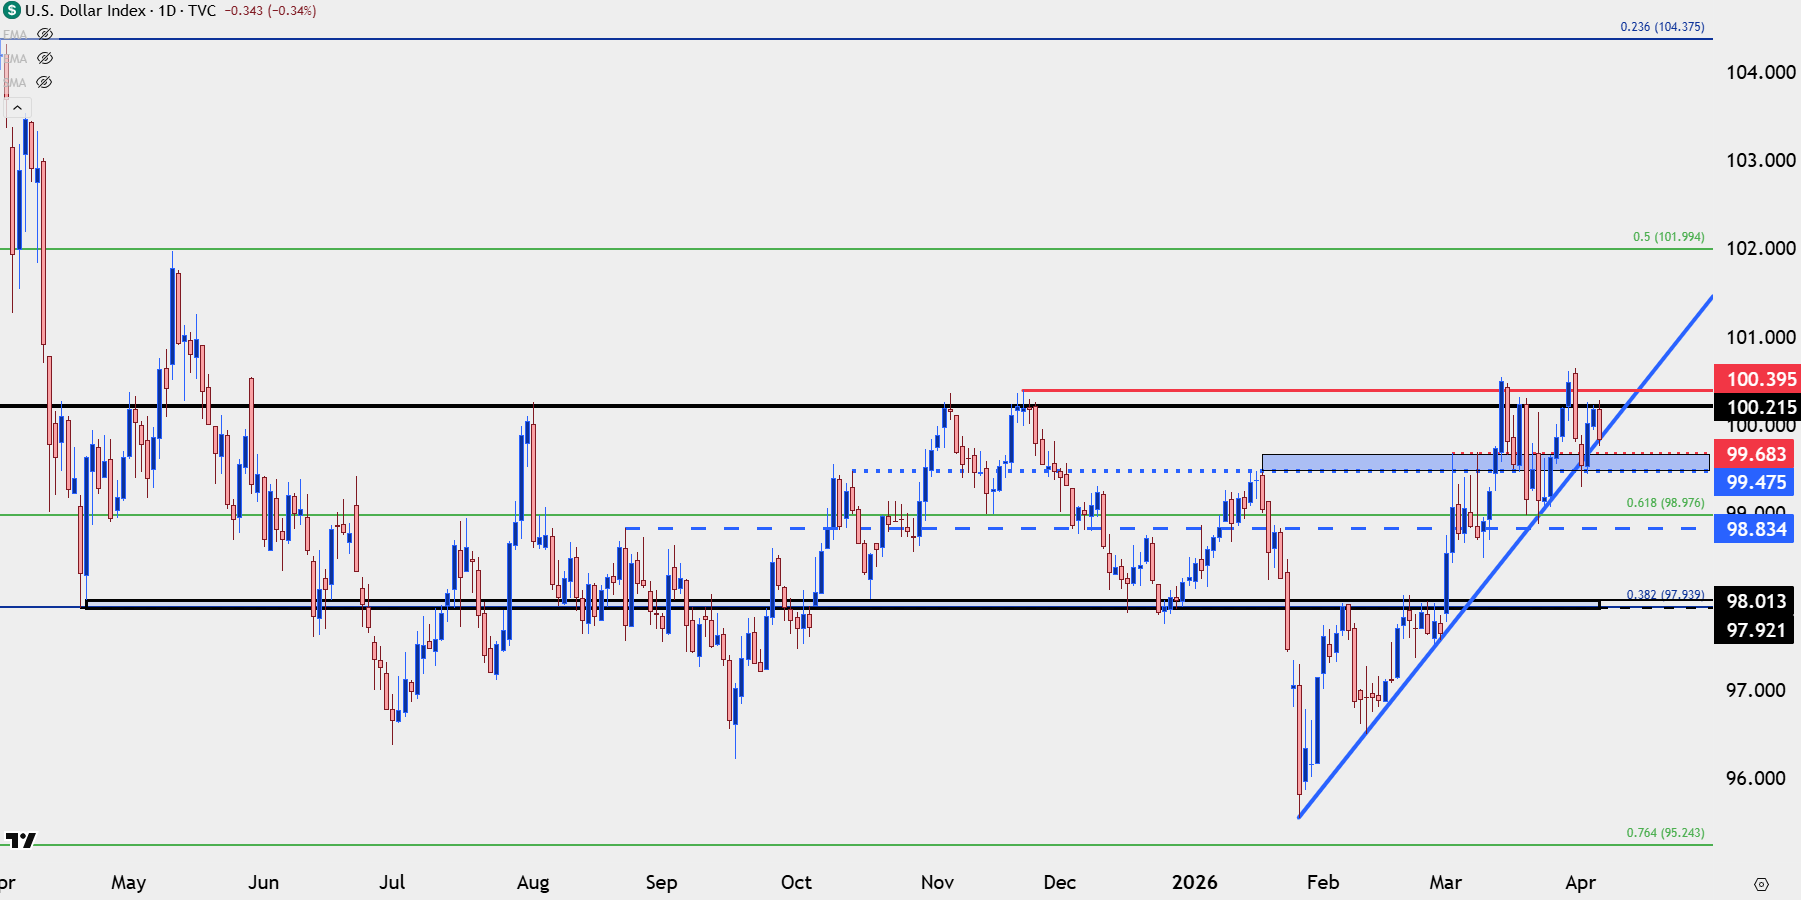
Chart prepared by James Stanley; data derived from Tradingview
USD/JPY
The 160.00 level has long been thought of the spot that the BoJ would ultimately be ordered to defend the Japanese currency. This was that line in the sand back in 2024 and, ultimately, that intervention worked ‘well’ because of a below-expected US CPI report that hit on the morning of July 11th that year.
But – there is also precedent for the MoF and the BoJ walking back from what was thought to be a clear line-in-the-sand, as it was the 145.00 level back in 2022 that the bank was defending until, ultimately, USD/JPY bulls broke through for the run up to the 150/151.95 level.
From the weekly chart below we’ve had higher lows over the past few weeks and bulls have already tip-toed beyond the 160.00 level. Shorter-term, it looks like buyers are getting more and more willing to test closer and closer to that line, keeping the door open for breakout potential.
So, perhaps it’s the 165.00 level that will get that intervention defense, or maybe it’s the 161.95 level that marked the top back in 2024 and is an even 1,000 pips above the 2022 and 2023 high which then became support in April of 2024 after the first (failed) defense of the 160.00 handle.
USD/JPY Weekly Price Chart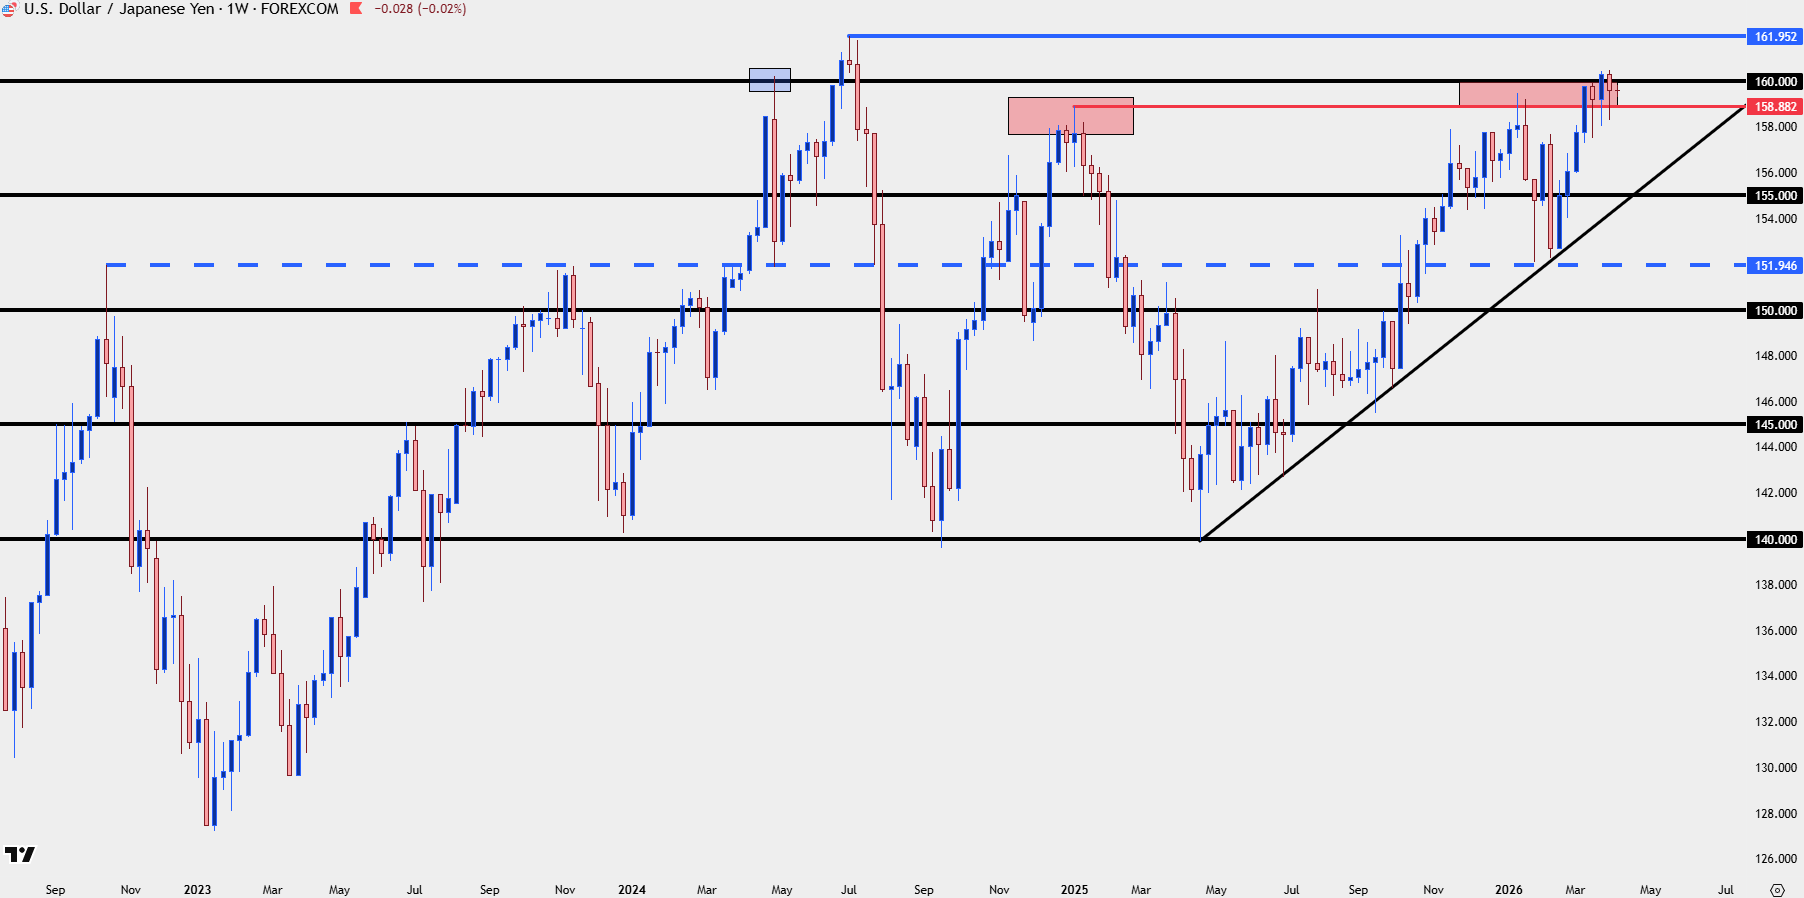
Chart prepared by James Stanley; data derived from Tradingview
EUR/USD
For USD-weakness I still favor EUR/USD as there’s been a continued build of higher-low supports at an important spot on the chart.
A couple of weeks ago I was looking for either a hold of 1.1500 or the prior higher-low at 1.1451. The latter eventually came in on the following Monday and Tuesday to contain that selling pressure and price is now holding above the 1.1500 level.
From the daily, this can be argued as a bear pennant formation, but if I’m looking for USD-strength I still think USD/JPY breakout setups are more attractive. For USD-weakness, a breach of 1.1655-1.1686 opens the door for buyers to exhibit greater control with pushes up to 1.1750 and then 1.1835.
EUR/USD Daily Chart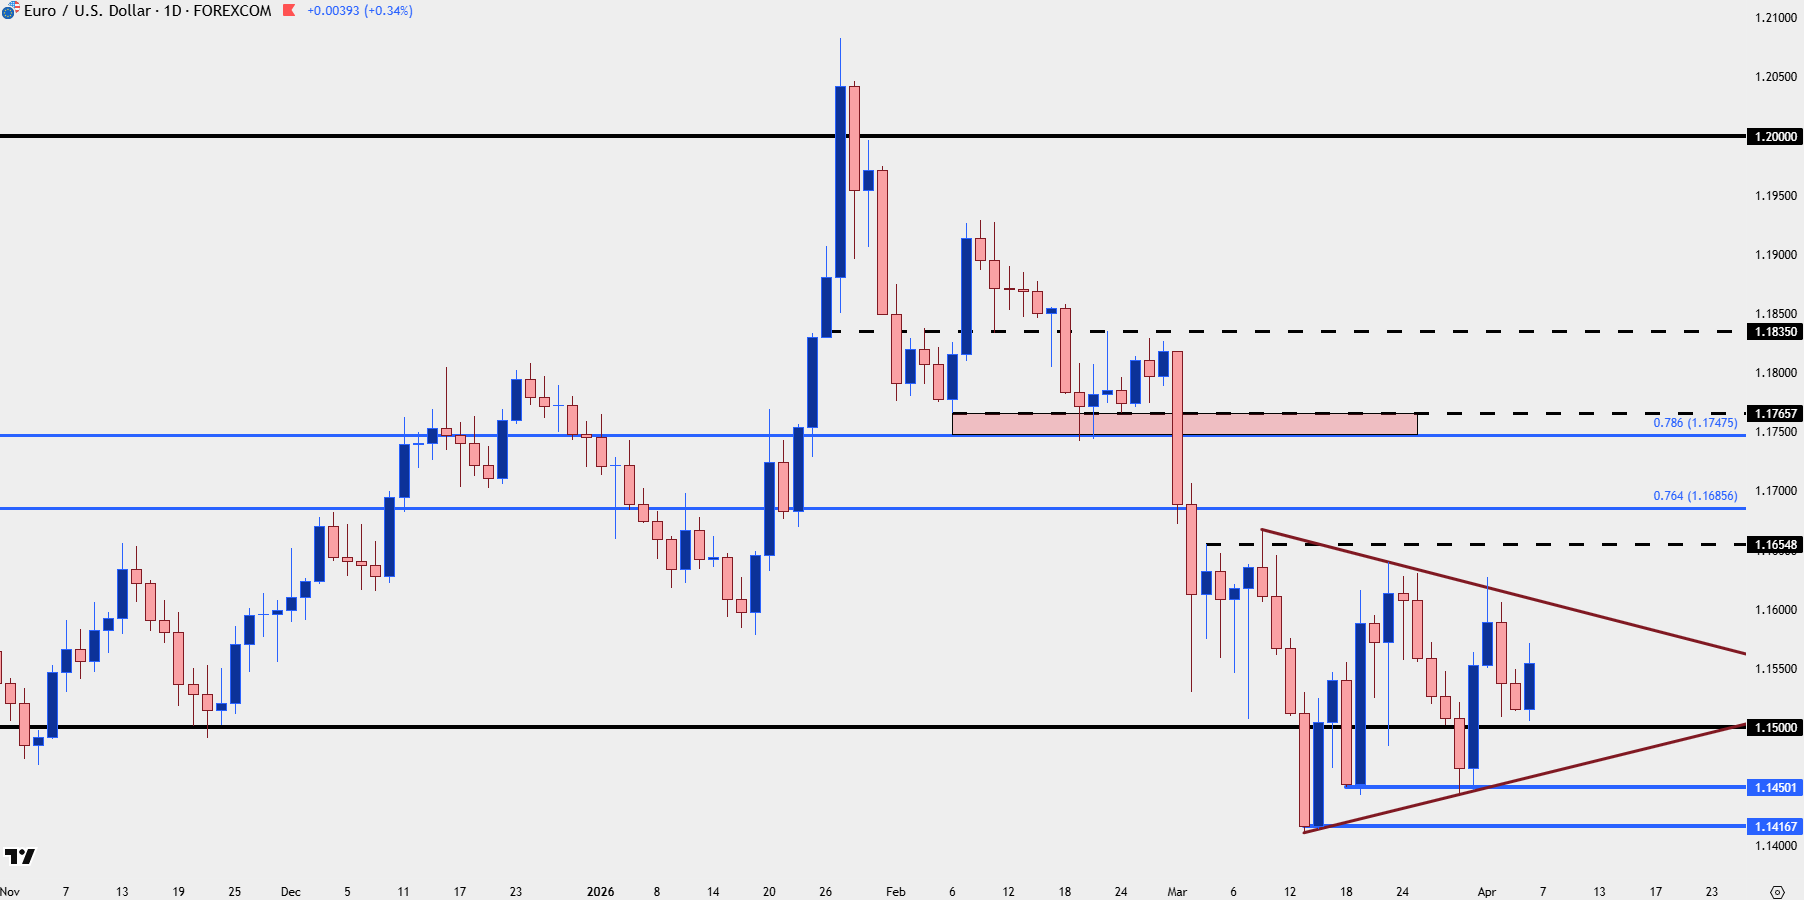
Chart prepared by James Stanley; data derived from Tradingview
--- written by James Stanley, Senior Market Analyst, Global Macro


Open an account in minutes
Experience award-winning platforms with fast and secure execution, and enjoy tight spreads from 0.5 pts on FX and 0.3 pts on indices.
Economic calendar
Web Trader platform
Our sophisticated web-based platform is packed with features.
Related articles
Nasdaq 100 Forecast: NDX falls as oil jumps and Treasury yields rise
U.S. stocks are pointing to a weaker open on Monday after President Trump rejected an Iranian ceasefire, sending oil prices higher and fuelling inflationary concerns and pushing Treasury yields higher.

Crude Oil Q4 2026 Outlook: Will a New Energy-Security Regime Emerge?
Crude Oil Q4 2026 Outlook: The U.S.-Iran conflict has done more than disrupt oil flows. It has challenged many of the assumptions underpinning the global energy security system established after the 1973 oil embargo.


Oil, Gold Forecast: Two trades to watch 280926
Oil Rises as U.S.-Iran Peace Hopes Fade. Gold Breaks Down on Hawkish Fed Expectations as Treasury Yields and USD Rise.
This report is intended for general circulation only. It should not be construed as a recommendation, or an offer (or solicitation of an offer) to buy or sell any financial products. The information provided does not take into account your specific investment objectives, financial situation or particular needs. Before you act on any recommendation that may be contained in this report, independent advice ought to be sought from a financial adviser regarding the suitability of the investment product, taking into account your specific investment objectives, financial situation or particular needs.
StoneX Financial Pte. Ltd., may distribute reports produced by its respective foreign entities or affiliates within the StoneX group of companies or third parties pursuant to an arrangement under Regulation 32C of the Financial Advisers Regulations. Where the report is distributed to a person in Singapore who is not an accredited investor, expert investor or an institutional investor (as defined in the Securities Futures Act), StoneX Financial Pte. Ltd. accepts legal responsibility to such persons for the contents of the report only to the extent required by law. Singapore recipients should contact StoneX Financial Pte. Ltd. at 6826 9988 for matters arising from, or in connection with the report.
In the case of all other recipients of this report, to the extent permitted by applicable laws and regulations neither StoneX Financial Pte. Ltd. nor its associated companies will be responsible or liable for any loss or damage incurred arising out of, or in connection with, any use of the information contained in this report and all such liability is hereby expressly disclaimed. No representation or warranty is made, express or implied, that the content of this report is complete or accurate.
StoneX Financial Pte. Ltd. is not under any obligation to update this report.
Trading CFDs carries a high level of risk that may not be suitable for some investors. Consider your investment objectives, level of experience, financial resources, risk appetite and other relevant circumstances carefully. The possibility exists that you could lose some or all of your investments, including your initial deposits. If in doubt, please seek independent expert advice. Visit www.forex.com/en-sg/terms-and-policies for the complete Risk Disclosure Statement.