



USD/JPY, Oil Forecast: Two trades to watch
USD/JPY Looks Towards 160 Ahead of U.S. CPI Data. Oil rises for a sixth straight session on Middle East supply worries.
Share this:



USD/JPY Looks Towards 160 Ahead of U.S. CPI Data
USD/JPY is creeping higher, even after joint intervention by Tokyo and Washington pulled the pair from 164 to 155. Just a week later, U.S. dollar bulls are already pushing the pair back towards the danger zone.
The yen has already given back nearly half of its intervention rally after the U.S. and Japan stepped in to stop the pair from reaching a fresh 40-year high. While the move worked as a short-term shock, it appears less capable of creating a lasting change in direction.
With Japanese interest rates still well below those in the U.S., the carry trade remains attractive. Investors can continue to borrow cheaply in yen and buy higher-yielding dollar assets, putting renewed pressure on the Japanese currency.
Attention now turns to U.S. CPI data, which is expected to show headline CPI rising 0.1% month-on-month and 3.4% year-on-year, down from 3.5%. Core CPI is expected to rise 0.2% month-on-month and 2.5% year-on-year, down from 2.6%.
A hotter-than-expected reading, particularly CPI of 0.3% or more on a monthly basis, could strengthen expectations of a September rate hike. This could push U.S. Treasury yields higher, making dollar assets more attractive and potentially lifting USD/JPY above 160.
Meanwhile, cooler-than-expected inflation, particularly following Friday's weaker-than-expected non-farm payroll report, could put pressure on Treasury yields and give the pair some breathing room.
U.S. CPI data is therefore key for setting expectations for the September Fed meeting and could also influence Federal Reserve Chair Walsh's speech at the Jackson Hole Symposium later this month.
USD/JPY Forecast – Technical Analysis
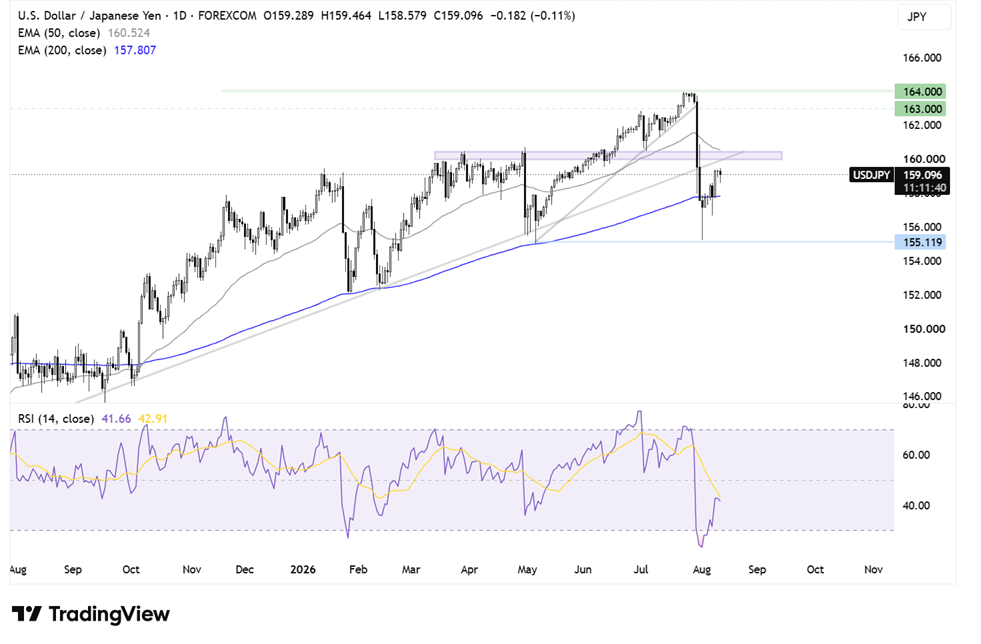
USD/JPY has recovered from the 155 low, rising back above the 200 EMA and heading towards the 160 resistance zone. There is a confluence of the multi-month rising trend line, horizontal resistance and the 50 EMA around this level.
A rise above 160 would put bulls firmly back on track and bring 163, the round number, and 164, the 2026 high, into focus.
On the downside, support is seen at 157.80, the 200 EMA. Below here, attention turns back towards 155, the August and May lows.
Oil Rises For A Sixth Straight Session On Middle East Supply Fears
Oil prices are rising on Wednesday amid ongoing concerns about supply disruptions in the Middle East, although data showing rising U.S. oil inventories could limit the upside for now.
Oil prices are rising for a sixth straight day, with WTI up more than 7% so far this week. The rise comes amid ongoing supply concerns, as Iran's top security officials said the Strait of Hormuz will remain closed unless the U.S. accepts Iran's conditions to end the war.
Shipping data shows the number of vessels transiting the Strait fell to a low of eight on Tuesday, significantly below the 130 vessels that passed through the crucial waterway each day before the war.
Separately, Iran-aligned Houthis reported attacks on ships in both the Strait of Hormuz and Bab el-Mandeb, adding to concerns over oil supply.
According to the International Energy Agency, global oil supply is expected to fall by 4.3 million barrels per day, or around 4%, this year, as renewed hostilities in the Middle East since July put the oil market into a deficit. This is a larger drop than the 3.7 million barrels per day forecast in the IEA's July report, taking the IEA's latest forecast for global supply to 102.02 million barrels per day.
However, according to API data, U.S. crude inventories rose sharply by 9.1 million barrels last week, while gasoline and distillate inventories fell by 1.5 million barrels.
Attention will be on EIA data later today to see whether the inventory build is confirmed by official data. If it is, this could provide some relief from the current supply concerns and limit further gains in oil prices.
For now, ongoing hostilities and the closure of the Strait of Hormuz are likely to keep oil prices supported.
Oil Forecast – Technical Analysis
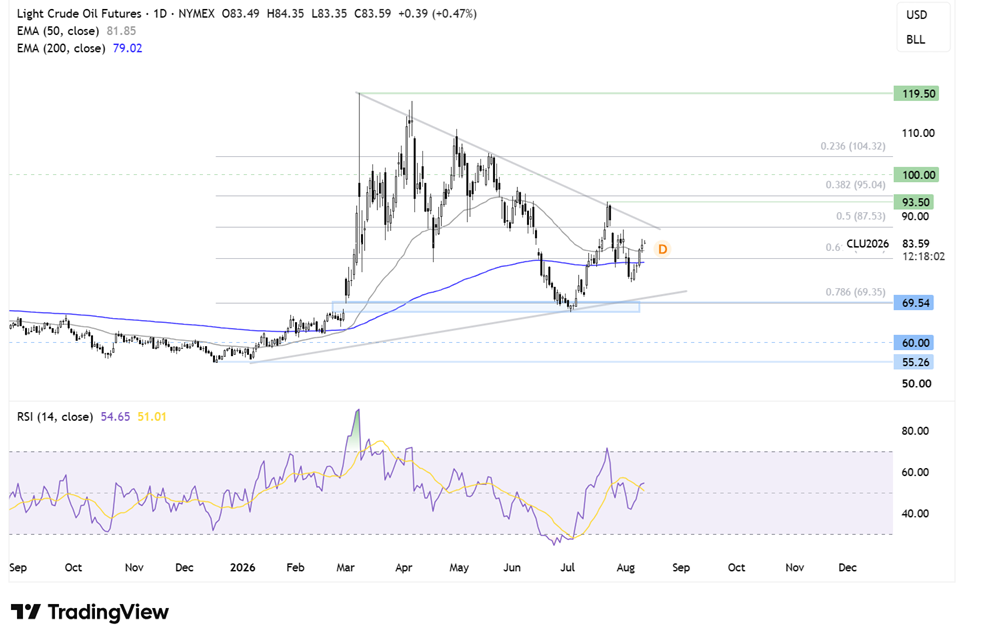
Oil is trading within a symmetrical triangle pattern. The price has recovered from $75, pushing above the 50 and 200 EMAs.
With the RSI above 50, buyers will look to extend gains towards $88, the 50% Fibonacci retracement of the move from the $55 low to the $120 high, as well as the falling trend line resistance.
A rise above here brings the 95 Fibonacci retracement level and the July high into focus. A break above this level would create a higher high and open the door towards $100.
On the downside, immediate support is seen at the 50 EMA at $81.80 and $80, the psychological level, followed by the 200 SMA and the 61.8% Fibonacci retracement level.
A break below these levels would bring $75, the August low, back into focus and could see sellers gain traction towards the $70 support zone.
Related tags:



Open an account in minutes
Experience award-winning platforms with fast and secure execution, and enjoy tight spreads from 0.5 pts on FX and 0.3 pts on indices.
Economic calendar
Web Trader platform
Our sophisticated web-based platform is packed with features.
Related articles
WTI Crude Oil Mulls Bounce from $90
Having fallen 17% from its cycle highs in just five days and now holding above $90, perhaps it could be time for crude oil to bounce over the near term.

USD/JPY outlook: Hawkish Fed recalibration pressures the yen
Stronger US growth momentum and rising Treasury yields are keeping USD/JPY pointed higher, even as Japanese policymakers try to limit the pressure building across domestic markets.


USD/JPY Bulls Continue to Push as Markets ‘Bet Against the House’
USD/JPY is now up by more than 500 pips from the low taken the day that Scott Bessent taunted markets, saying ‘you can bet against me if you want.’

This report is intended for general circulation only. It should not be construed as a recommendation, or an offer (or solicitation of an offer) to buy or sell any financial products. The information provided does not take into account your specific investment objectives, financial situation or particular needs. Before you act on any recommendation that may be contained in this report, independent advice ought to be sought from a financial adviser regarding the suitability of the investment product, taking into account your specific investment objectives, financial situation or particular needs.
StoneX Financial Pte. Ltd., may distribute reports produced by its respective foreign entities or affiliates within the StoneX group of companies or third parties pursuant to an arrangement under Regulation 32C of the Financial Advisers Regulations. Where the report is distributed to a person in Singapore who is not an accredited investor, expert investor or an institutional investor (as defined in the Securities Futures Act), StoneX Financial Pte. Ltd. accepts legal responsibility to such persons for the contents of the report only to the extent required by law. Singapore recipients should contact StoneX Financial Pte. Ltd. at 6826 9988 for matters arising from, or in connection with the report.
In the case of all other recipients of this report, to the extent permitted by applicable laws and regulations neither StoneX Financial Pte. Ltd. nor its associated companies will be responsible or liable for any loss or damage incurred arising out of, or in connection with, any use of the information contained in this report and all such liability is hereby expressly disclaimed. No representation or warranty is made, express or implied, that the content of this report is complete or accurate.
StoneX Financial Pte. Ltd. is not under any obligation to update this report.
Trading CFDs carries a high level of risk that may not be suitable for some investors. Consider your investment objectives, level of experience, financial resources, risk appetite and other relevant circumstances carefully. The possibility exists that you could lose some or all of your investments, including your initial deposits. If in doubt, please seek independent expert advice. Visit www.forex.com/en-sg/terms-and-policies for the complete Risk Disclosure Statement.