



USD/JPY Short-Term Bullish Structure Amidst Recent Bearish Shift
Perhaps no pair illustrates as large of a dichotomy between short and long-terms right now as USD/JPY, and the big question remains how aggressive policymakers might try to be on continued strength.
Share this:

USD/JPY Talking Points:
- From shorter-terms, USD/JPY remains rather clean with higher-highs and lows and quite a bit of structure from prior swings. Last week saw a strong bounce from the 155.00 handle around FOMC and BoJ rate decisions.
- Longer-term, however, questions abound about where the next line-in-the-sand might be, and this can constrain rallies as buyers show trepidation of testing fresh breakouts as the 160.00 level nears.
- The larger facet of carry unwind would be fundamental convergence between the two economies and that doesn’t appear nearby, at this point.

If you look at USD/JPY from short-term charts, there’s a clear bullish trend that’s been in-place for most of the past two weeks. From longer-term charts, however, a shift has clearly taken place since Scott Bessent and the Japanese Finance Ministry intervened on the matter almost two months ago.
The past two weeks have seen support delivered from the five-year trendline in the pair. But, from the weekly chart below a clear change of pace has shown.
USD/JPY Weekly Chart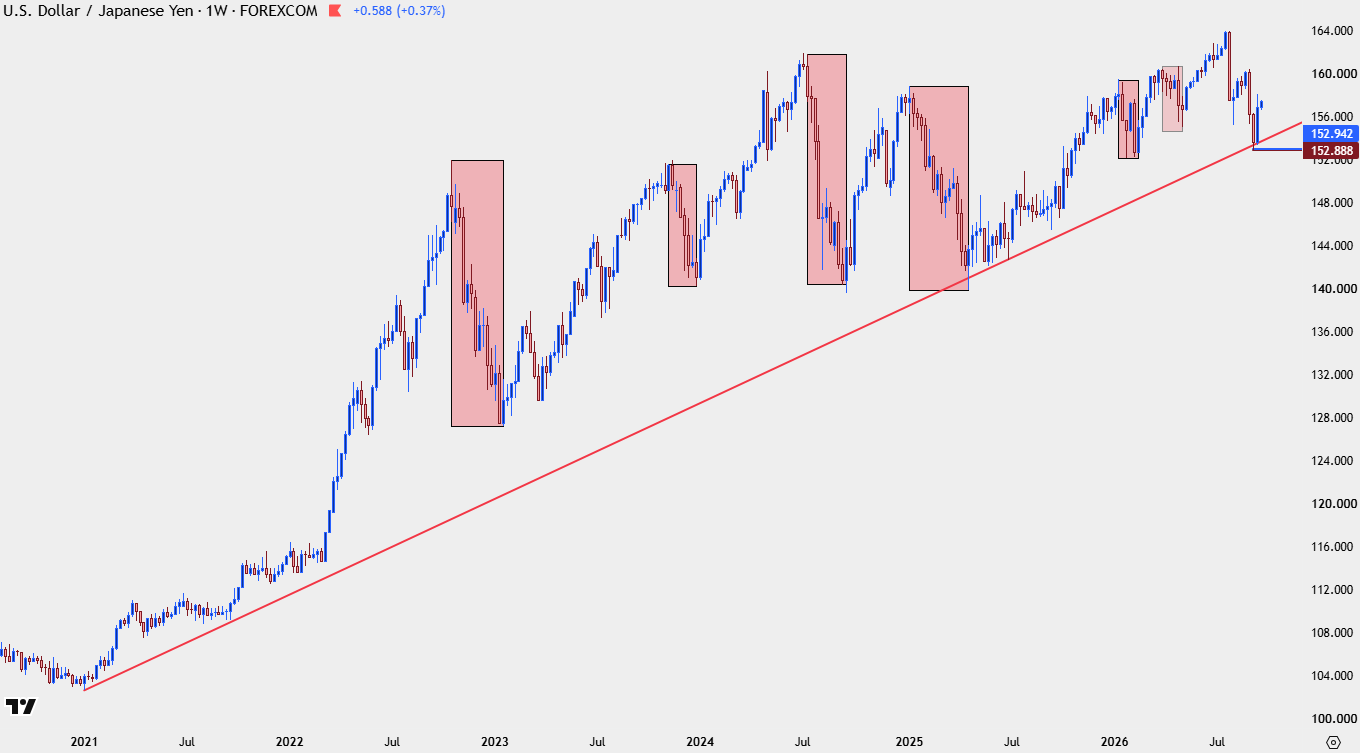
Chart prepared by James Stanley; data derived from Tradingview
What is clear: Significant Yen weakness will probably not be tolerated beyond the 164.00 level where we had seen a prior intervention. And this is, perhaps, relevant to the 160.00 level as well following the strong sell-off that developed three weeks ago as buyers were showing more comfort above that level.
After sell-offs, however, given the still positive carry on the long side of the pair along with some upside room until one of those problem areas might come into play, and there could be motive for buyers to jump in very much like what we’ve seen.
Perhaps most telling, it was two weeks ago when US Treasury Secretary Scott Bessent issued his clearest warning yet, saying he has asymmetric information and he knows what the Bank of Japan is going to do and he knows what Japanese policymakers will do. He then went on to say ‘you can bet against me if you want.’ And while the initial reaction to that comment was weakness in the pair – USD/JPY still didn’t break down to a fresh low. Buyers simply showed up around the 153.00 level and at this point the pair is more than 400 pips higher.
This is, of course, the type of headline that gets attention, as the Treasury Secretary baits markets only for the market to growl right back. But, in reality, this magnifies the dynamic noted above, where intervention after a five or six hundred pip sell-off makes little sense, especially when monetary policy is still decisively tilted against it.
USD/JPY Daily Chart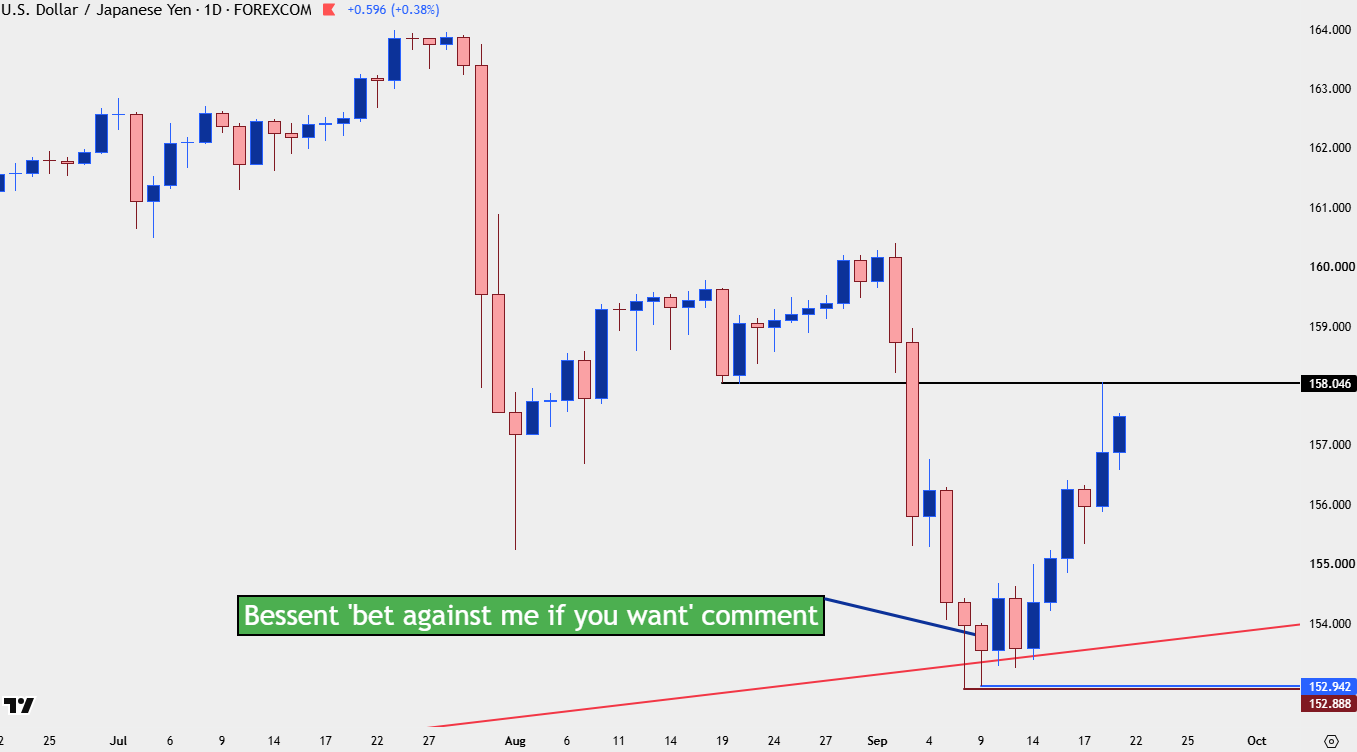
Chart prepared by James Stanley; data derived from Tradingview
USD/JPY Shorter-Term
At this point bidding dips can still be argued in the pair. But the conversation around the long side grows less attractive as prices push higher and get closer to those previous lines-in-the-sand. The fear being, of course, an intervention, or a comment similar to that, as the risk-reward gets increasingly less attractive the further price rallies from support and the closer it gets to one of these spots that might elicit a response from policymakers, either on the US or Japanese side.
At this point, I think 160 can be assumed as a possible area that could produce something of that nature as we saw a massive sell-off after the last test of the big figure. But the 158.05 level may not present as much worry, even though it did provide a clean reversal on Friday morning. That was a prior swing of support and in the post-BoJ breakout, that’s what ultimately carved out the highs. It makes sense the buyers saw price test prior support and decided to take profit off the table after a smooth one-sided run.
In the aftermath of that, another key level has come back into play and this time as support at 156.68. This was a higher low back in August when the pair was recovering from the initial sell-off driven by the dual intervention, and it came in as resistance earlier in September. On Friday, this price helped to mark the swing low that has so far been defended as bulls have returned shortly after.
If we do see a larger pullback, the 155.00 area is of interest as this is what held the lows around FOMC, and that can be synced up to a spot of resistance turned support at 155.37.
USD/JPY Four-Hour Chart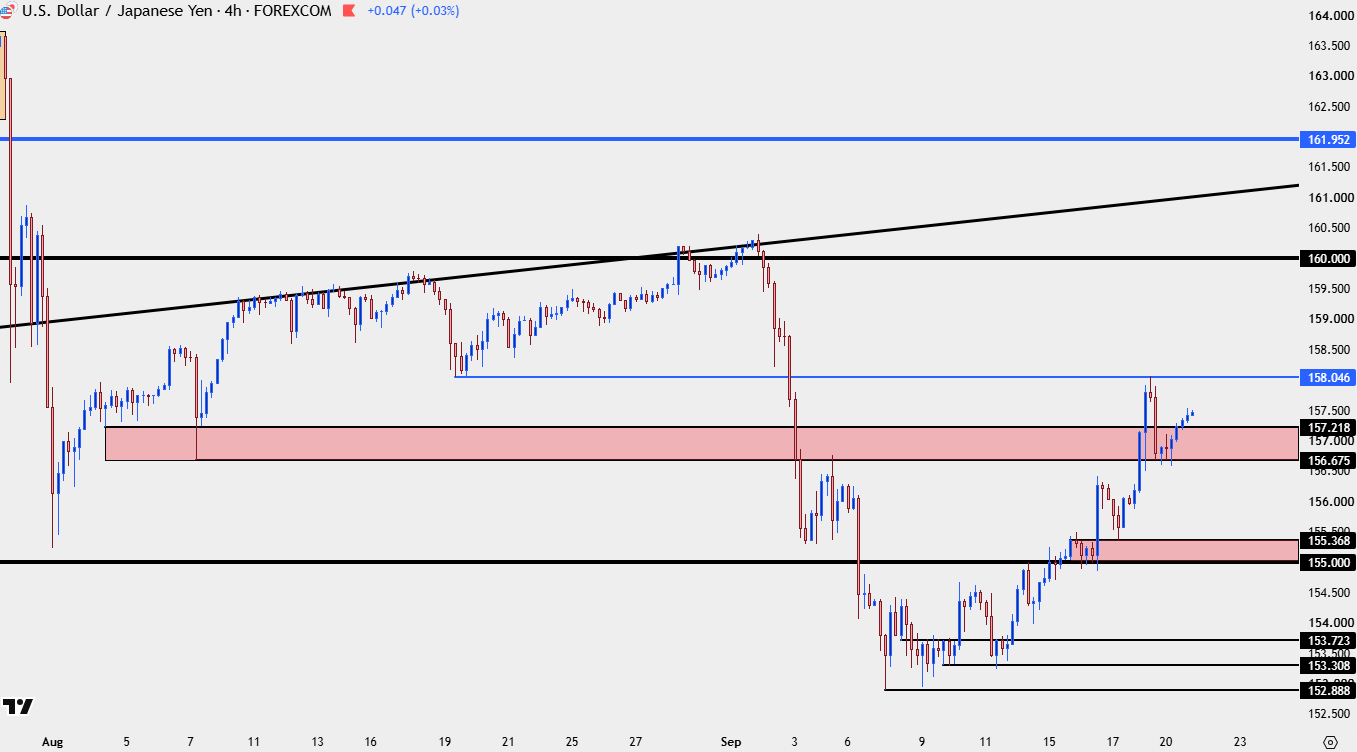
Chart prepared by James Stanley; data derived from Tradingview
--- written by James Stanley, Senior Market Analyst, Global Macro



Open an account in minutes
Experience award-winning platforms with fast and secure execution, and enjoy tight spreads from 0.5 pts on FX and 0.3 pts on indices.
Economic calendar
Web Trader platform
Our sophisticated web-based platform is packed with features.
Related articles

USD/JPY outlook: Hawkish Fed recalibration pressures the yen
Stronger US growth momentum and rising Treasury yields are keeping USD/JPY pointed higher, even as Japanese policymakers try to limit the pressure building across domestic markets.


USD/JPY Bulls Continue to Push as Markets ‘Bet Against the House’
USD/JPY is now up by more than 500 pips from the low taken the day that Scott Bessent taunted markets, saying ‘you can bet against me if you want.’

USD/JPY forecast: US dollar strengths amid hawkish Fed despite recent oil weakness
The US dollar has extended its gains this morning, even if oil prices finished lower for the fifth consecutive day yesterday. Oil prices have bounced back in this first half of today’s session, causing a bit of pressure on currencies that rely on energy imports such as the euro, pound, Swiss franc, and Japanese yen. But it was the dollar that was exerting the most pressure, amid hawkish FedSpeak. Meanwhile, European indices and precious metals were also under a bit of pressure amid the strength of the dollar.

This report is intended for general circulation only. It should not be construed as a recommendation, or an offer (or solicitation of an offer) to buy or sell any financial products. The information provided does not take into account your specific investment objectives, financial situation or particular needs. Before you act on any recommendation that may be contained in this report, independent advice ought to be sought from a financial adviser regarding the suitability of the investment product, taking into account your specific investment objectives, financial situation or particular needs.
StoneX Financial Pte. Ltd., may distribute reports produced by its respective foreign entities or affiliates within the StoneX group of companies or third parties pursuant to an arrangement under Regulation 32C of the Financial Advisers Regulations. Where the report is distributed to a person in Singapore who is not an accredited investor, expert investor or an institutional investor (as defined in the Securities Futures Act), StoneX Financial Pte. Ltd. accepts legal responsibility to such persons for the contents of the report only to the extent required by law. Singapore recipients should contact StoneX Financial Pte. Ltd. at 6826 9988 for matters arising from, or in connection with the report.
In the case of all other recipients of this report, to the extent permitted by applicable laws and regulations neither StoneX Financial Pte. Ltd. nor its associated companies will be responsible or liable for any loss or damage incurred arising out of, or in connection with, any use of the information contained in this report and all such liability is hereby expressly disclaimed. No representation or warranty is made, express or implied, that the content of this report is complete or accurate.
StoneX Financial Pte. Ltd. is not under any obligation to update this report.
Trading CFDs carries a high level of risk that may not be suitable for some investors. Consider your investment objectives, level of experience, financial resources, risk appetite and other relevant circumstances carefully. The possibility exists that you could lose some or all of your investments, including your initial deposits. If in doubt, please seek independent expert advice. Visit www.forex.com/en-sg/terms-and-policies for the complete Risk Disclosure Statement.