



USDJPY, Nasdaq Outlook: DXY Resistance, Earnings, and Tariffs
The DXY is facing resistance near the 100 level, USDJPY is testing the 153.40 barrier, and the Nasdaq has rebounded from the 24,000 support, now facing resistance around 24,800. How will tariff developments and key earnings reports shape market trends this week?
Share this:

Key Events
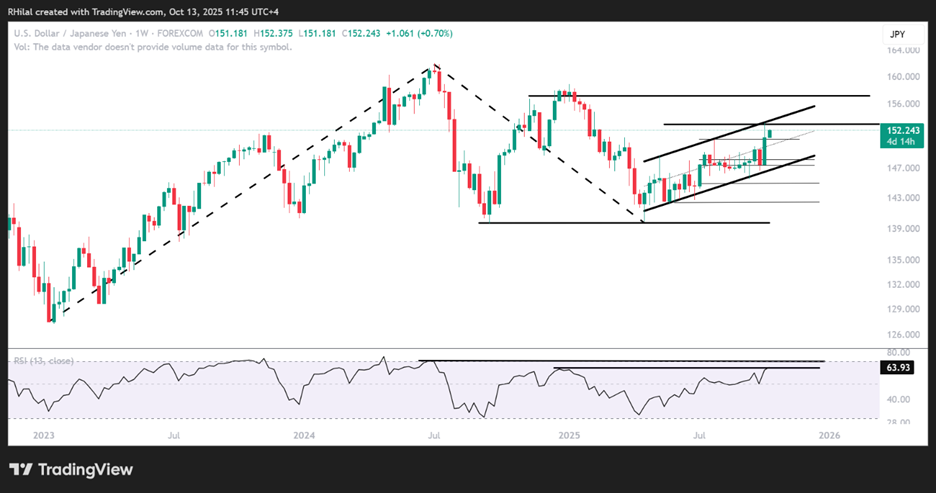
- USDJPY is facing a six-month resistance at 153.40, with weekly overbought levels last seen in December 2024.
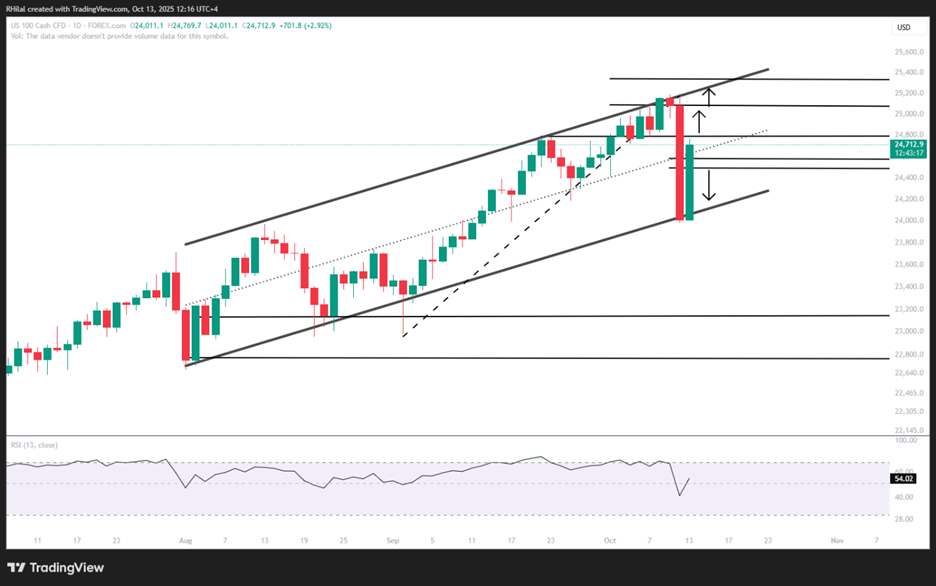
- Nasdaq is in recovery mode following U.S.–China tariff volatility, testing the 24,800-mark ahead of U.S. bank earnings on Tuesday and Wednesday, and Taiwan Semiconductor earnings on Thursday.
- U.S. economic reports, notably the CPI, remain tentative due to the ongoing government shutdown.
Market volatility remains anchored between multiple layers of uncertainty — the U.S. government shutdown, U.S.–China tariff tensions, unreleased economic data, rate-cut expectations, and anticipation ahead of corporate earnings.
Headlines are expected to fluctuate as markets digest short-term distress while looking toward future resolutions. This backdrop keeps havens near record highs, the dollar firm yet facing resistance below the 100.20 mark, and U.S. indices in a fragile recovery mode after Friday’s sell-off from overheated levels.
Will we see another tariff sell-off, tariff delay, and bull-run scenario play out on the charts again?
Technical Analysis: Quantifying Uncertainties
USDJPY Outlook: Weekly Time Frame – Log Scale
Source: Tradingview
USDJPY’s positive rebound from the April 2025 lows (139.88) has respected the bounds of a 6-month parallel channel, reaching the 0.382 Fibonacci resistance of the trend extending between the January 2023 low (127.22), July 2024 high (161.95), and April 2025 low (139.88) at 153.40.
A clean hold above 153.40 is expected to drive the trend toward the next Fibonacci level at the 0.5 extension, aligning with the 2025 highs near 157.
On the downside, with weekly overbought conditions aligning with highs last seen in Dec 2024, a drop back below 150.90 could trigger a revisit to the channel’s lower boundary near 148 and 147.40.
Nasdaq Outlook: Daily Time Frame – Log Scale
Source: Tradingview
The recent tariff hit on the Nasdaq aligned with the 25,000 zone and the August–October resistance line, connecting the upper bound of a parallel channel that the Nasdaq continues to respect. After rebounding cleanly from the 24,000 support, price action is now trading near the midpoint of the channel as tariff headlines evolve and ahead of major bank and semiconductor earnings this week.
Currently, price is testing the 24,800-resistance. A clean break above could extend gains toward 25,000 and a new high near 25,300, realigning with the upper boundary before confirming another bullish breakout toward 26,000.
On the downside, if tariff concerns resurface — similar to the early 2025 sell-off following the reciprocal tariff announcement — a clean break below 23,900 could trigger another 1,000-point drop toward 23,100 and 22,700, potentially setting up another long-term bullish opportunity.
Written by Razan Hilal, CMT
Follow on X: @Rh_waves
Related tags:
Latest market news



Open an account in minutes
Experience award-winning platforms with fast and secure execution, and enjoy tight spreads from 0.5 pts on FX and 0.3 pts on indices.
Economic calendar
Web Trader platform
Our sophisticated web-based platform is packed with features.
Related articles
EUR/USD weekly outlook: Oil, inflation and NFP in focus
After coming under significant pressure in recent weeks, the EUR/USD came off its lows to finish the week on a positive note on Friday, albeit with only a mild rebound. That was not enough to prevent the exchange rate falling for the third consecutive week, as the US dollar and bond yields rallied across the board.
EUR/USD Q4 2026 Outlook: Euro at a Crossroads as Fed, ECB Tighten 9 25 2026
EUR/USD enters Q4 at a pivotal inflection point as competing Fed-ECB policy paths and persistent inflation risks collide with major technical support.


Equity Indices Q4, 2026 Outlook: Cracks Begin to Show
There's still an open door for a melt-up in the S&P 500 and Nasdaq but the Dow and Russell 2000 are looking more vulnerable, and until calm hits the Treasuries market there's a higher probability for volatility. The big question is whether that's a next quarter theme or not.

This report is intended for general circulation only. It should not be construed as a recommendation, or an offer (or solicitation of an offer) to buy or sell any financial products. The information provided does not take into account your specific investment objectives, financial situation or particular needs. Before you act on any recommendation that may be contained in this report, independent advice ought to be sought from a financial adviser regarding the suitability of the investment product, taking into account your specific investment objectives, financial situation or particular needs.
StoneX Financial Pte. Ltd., may distribute reports produced by its respective foreign entities or affiliates within the StoneX group of companies or third parties pursuant to an arrangement under Regulation 32C of the Financial Advisers Regulations. Where the report is distributed to a person in Singapore who is not an accredited investor, expert investor or an institutional investor (as defined in the Securities Futures Act), StoneX Financial Pte. Ltd. accepts legal responsibility to such persons for the contents of the report only to the extent required by law. Singapore recipients should contact StoneX Financial Pte. Ltd. at 6826 9988 for matters arising from, or in connection with the report.
In the case of all other recipients of this report, to the extent permitted by applicable laws and regulations neither StoneX Financial Pte. Ltd. nor its associated companies will be responsible or liable for any loss or damage incurred arising out of, or in connection with, any use of the information contained in this report and all such liability is hereby expressly disclaimed. No representation or warranty is made, express or implied, that the content of this report is complete or accurate.
StoneX Financial Pte. Ltd. is not under any obligation to update this report.
Trading CFDs carries a high level of risk that may not be suitable for some investors. Consider your investment objectives, level of experience, financial resources, risk appetite and other relevant circumstances carefully. The possibility exists that you could lose some or all of your investments, including your initial deposits. If in doubt, please seek independent expert advice. Visit www.forex.com/en-sg/terms-and-policies for the complete Risk Disclosure Statement.