



What is the VIX telling us
In amongst the explosive price action the past six weeks, there have been a few short term reliable patterns for traders to reference. One such example is since the S&P 500 commenced falling from its 3397.50 high in February, five of the six re-opens on a Monday morning have featured the S&P 500 futures “gapping” lower on the re-open. Essentially a “gap lower open” represents an immediate lower repricing of risk assets following negative news headlines over the weekend. In recent weeks the gaps have followed news relating to the global spread of COVID-19, intermixed with bearish headlines for crude oil.
Share this:

In amongst the explosive price action the past six weeks, there have been a few short term reliable patterns for traders to reference. One such example is since the S&P 500 commenced falling from its 3397.50 high in February, five of the six re-opens on a Monday morning have featured the S&P 500 futures “gapping” lower on the re-open.
Essentially a “gap lower open” represents an immediate lower repricing of risk assets following negative news headlines over the weekend. In recent weeks the gaps have followed news relating to the global spread of COVID-19, intermixed with bearish headlines for crude oil.
Following this weekend’s better news that European COVID-19 hotspots, Spain, Italy, and France reported lower death tolls as well as a levelling off in new COVID-19 cases in New York, the S&P 500 has opened this morning unchanged, bucking the trend of lower re-opens.
A feat that is more notable as crude oil futures fell sharply on their open after Russia and OPEC postponed a crucial meeting to discuss production cuts. The price action in the S&P 500 is supportive of the view that markets have turned a corner, both in terms of price and volatility.
One of the most commonly looked at gauges of volatility is the Chicago Board Options Exchange (CBOE), Volatility Index (VIX), which measures the market's expectation of 30-day forward-looking volatility and is often referred to as the markets “Index of Fear”.
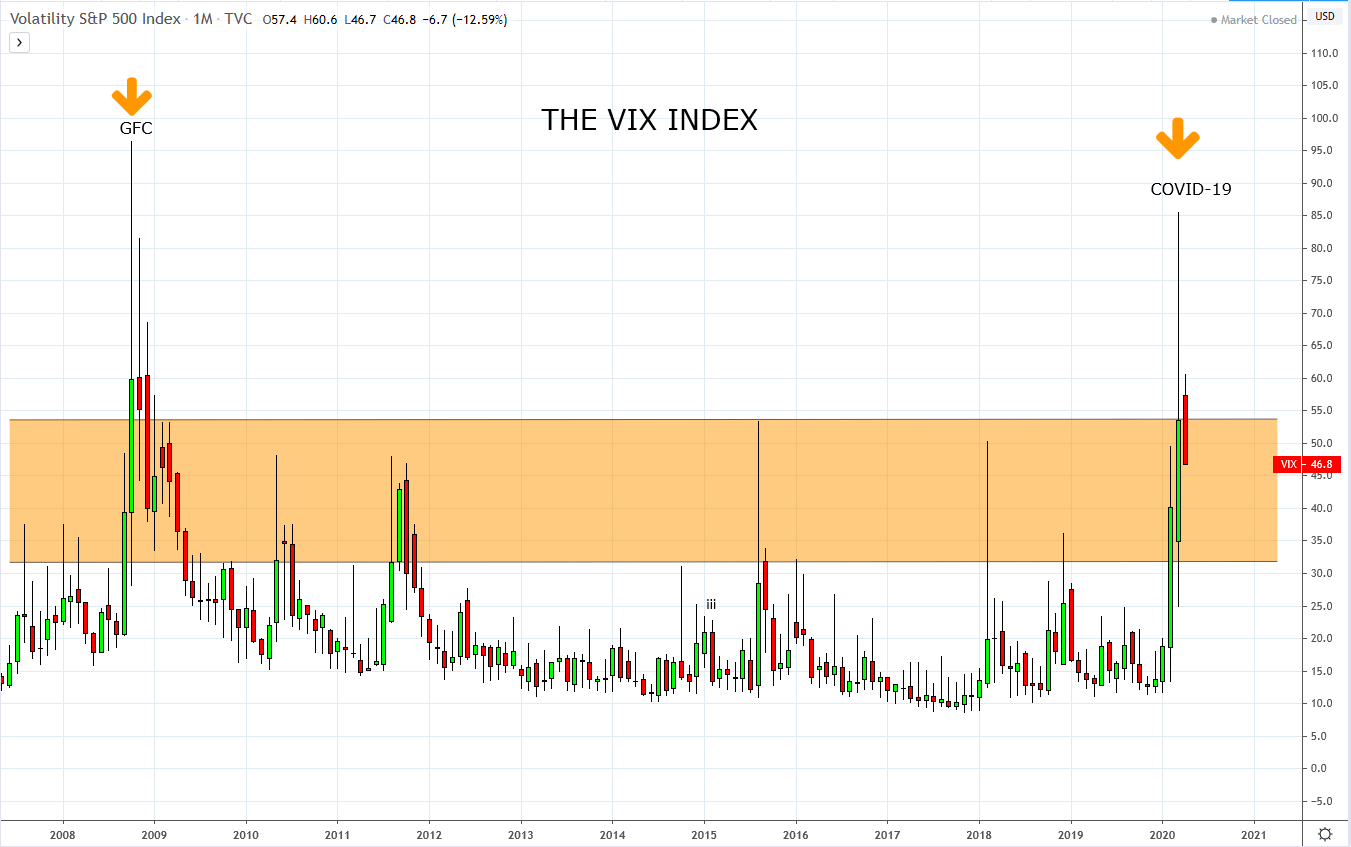
As can be seen in the chart below, the VIX spiked above 85 in Mid-March to near to its Global Financial Crisis (GFC) high before falling back below 50. While we think it is likely the VIX has seen its high for this episode, it’s unlikely that it continues to fall back to the benign levels it was trading at the start of the year.
Instead, the expectation is for the VIX to consolidate in the coming weeks at levels between 55 and 35, representative of the market entering a choppy period of “2 steps forward and 1 ½ steps back” type movements.
Source Tradingview. The figures stated areas of the 6th of April 2020. Past performance is not a reliable indicator of future performance. This report does not contain and is not to be taken as containing any financial product advice or financial product recommendation
Related tags:




Open an account in minutes
Experience award-winning platforms with fast and secure execution, and enjoy tight spreads from 0.5 pts on FX and 0.3 pts on indices.
Economic calendar
Web Trader platform
Our sophisticated web-based platform is packed with features.
Related articles
Nikkei 225 Eyes Wall Street Bounce Ahead of NFP
Wall Street rebounds as Fed hike bets ease, while Nikkei 225 futures eye 66k resistance ahead of US nonfarm payrolls.

Wall Street Stabilises: Can Nikkei and ASX Extend Their Bounce?
Wall Street steadies after a choppy week as traders assess whether the ASX 200 and Nikkei can build on early signs of a technical bounce.
Nasdaq 100 Leads Wall Street Rebound as Middle East Peace Boosts Risk
Nasdaq 100 futures lead Wall Street higher as Middle East peace hopes lift risk appetite, while the Dow Jones nears fresh record highs.
This report is intended for general circulation only. It should not be construed as a recommendation, or an offer (or solicitation of an offer) to buy or sell any financial products. The information provided does not take into account your specific investment objectives, financial situation or particular needs. Before you act on any recommendation that may be contained in this report, independent advice ought to be sought from a financial adviser regarding the suitability of the investment product, taking into account your specific investment objectives, financial situation or particular needs.
StoneX Financial Pte. Ltd., may distribute reports produced by its respective foreign entities or affiliates within the StoneX group of companies or third parties pursuant to an arrangement under Regulation 32C of the Financial Advisers Regulations. Where the report is distributed to a person in Singapore who is not an accredited investor, expert investor or an institutional investor (as defined in the Securities Futures Act), StoneX Financial Pte. Ltd. accepts legal responsibility to such persons for the contents of the report only to the extent required by law. Singapore recipients should contact StoneX Financial Pte. Ltd. at 6826 9988 for matters arising from, or in connection with the report.
In the case of all other recipients of this report, to the extent permitted by applicable laws and regulations neither StoneX Financial Pte. Ltd. nor its associated companies will be responsible or liable for any loss or damage incurred arising out of, or in connection with, any use of the information contained in this report and all such liability is hereby expressly disclaimed. No representation or warranty is made, express or implied, that the content of this report is complete or accurate.
StoneX Financial Pte. Ltd. is not under any obligation to update this report.
Trading CFDs carries a high level of risk that may not be suitable for some investors. Consider your investment objectives, level of experience, financial resources, risk appetite and other relevant circumstances carefully. The possibility exists that you could lose some or all of your investments, including your initial deposits. If in doubt, please seek independent expert advice. Visit www.forex.com/en-sg/terms-and-policies for the complete Risk Disclosure Statement.