






WTI Gaps Higher after Supply Disruptions
Supply disruptions in Libya and Iraq over the weekend were the culprits for the price jump.
Share this:

The US equity and bond markets are closed today in observance of Martin Luther King Jr. Day, however the fx markets are open, as well as the overnight session (which is abbreviated) for many futures products. When the crude futures markets opened last night in the US, they gapped higher from a Friday close of 58.58 per barrel to 59.77 per barrel. Supply disruptions in Libya and Iraq over the weekend were the culprits for the price jump. In Libya, military forces shut down a key pipeline. In Iraq, workers protested over working conditions shut down an oil production facility halting oil supply. Price has since pulled back and filled the gap, however WTI is still up 0.4% on the day near 58.75 per barrel.
Source: Tradingview, NYMEX, City Index
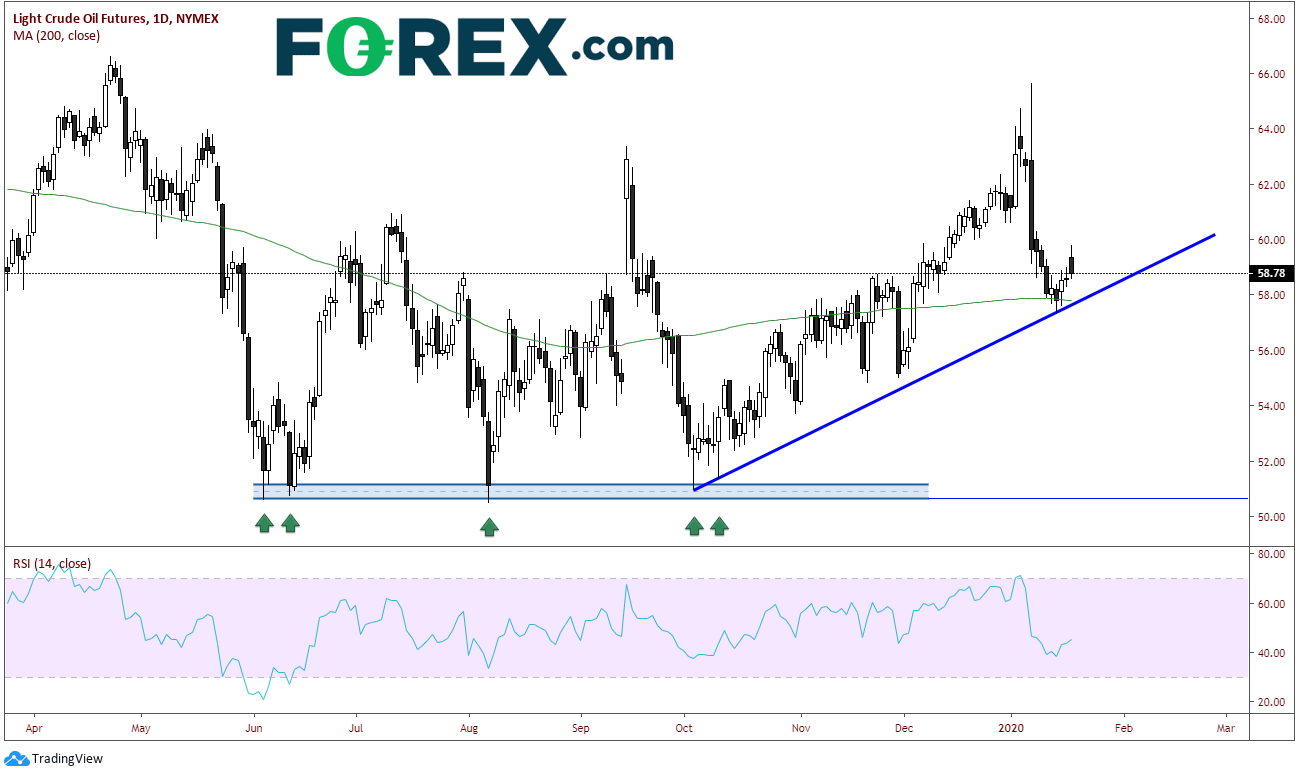
Geo-political events have been the focus since the beginning of 2020 for the oil markets, in particular, between the US and Iran. On January 8th, WTI traded as high as 65.65 as Iran attacked US military bases in in Iraq. However, markets faded the move higher and closed at 59.61, down 5% on the day! Over the course of the next few days, price continued to trade lower, however support at the 200-day moving average near 58.00 held. In addition, there is an upward sloping trendline from the October 1st lows which also held near 58.00. On a daily timeframe, today the price action in crude formed a black bearish candle after the gap higher.
Source: Tradingview, NYMEX, City Index
On a 240-minute time-frame, WTI not only support from the daily timeframe, but also the 50% retracement level from the lows on October 3rd to the spike high on January 8th, again near 58.00. If price can continue to hold this level, horizontal resistance above comes across near 60.65 and 62.50. Above that, resistance comes across that the previously mentioned spike highs near 65.65. First support is confluence of indicators mentioned near 58.00. Below that is the 61.8% Fibonacci retracement level of the previously mentioned timeframe near 56.65 and horizonal support near 55.00. Further support is the October 3rd lows near 51.00.
Source: Tradingview, NYMEX, City Index
Continue to watch the 58.00 level for WTI. It has proved to be good support in the near term. In addition, notice that moves higher since the beginning of the year due to geo-political events have tended to be faded. Is this a trend? Also, as mentioned in our Oil week ahead write up, Davos begins this week on Wednesday. Watch for comments which may be market moving. We also have the usually weekly API and DOE data due out Wednesday and Thursday, respectively (delayed 1 day due to the US holiday).
The US equity and bond markets are closed today in observance of Martin Luther King Jr. Day, however the fx markets are open, as well as the overnight session (which is abbreviated) for many futures products. When the crude futures markets opened last night in the US, they gapped higher from a Friday close of 58.58 per barrel to 59.77 per barrel. Supply disruptions in Libya and Iraq over the weekend were the culprits for the price jump. In Libya, military forces shut down a key pipeline. In Iraq, workers protested over working conditions shut down an oil production facility halting oil supply. Price has since pulled back and filled the gap, however WTI is still up 0.4% on the day near 58.75 per barrel.
Source: Tradingview, NYMEX, FOREX.com
Geo-political events have been the focus since the beginning of 2020 for the oil markets, in particular, between the US and Iran. On January 8th, WTI traded as high as 65.65 as Iran attacked US military bases in in Iraq. However, markets faded the move higher and closed at 59.61, down 5% on the day! Over the course of the next few days, price continued to trade lower, however support at the 200-day moving average near 58.00 held. In addition, there is an upward sloping trendline from the October 1st lows which also held near 58.00. On a daily timeframe, today the price action in crude formed a black bearish candle after the gap higher.
Source: Tradingview, NYMEX, FOREX.com
On a 240-minute time-frame, WTI not only support from the daily timeframe, but also the 50% retracement level from the lows on October 3rd to the spike high on January 8th, again near 58.00. If price can continue to hold this level, horizontal resistance above comes across near 60.65 and 62.50. Above that, resistance comes across that the previously mentioned spike highs near 65.65. First support is confluence of indicators mentioned near 58.00. Below that is the 61.8% Fibonacci retracement level of the previously mentioned timeframe near 56.65 and horizonal support near 55.00. Further support is the October 3rd lows near 51.00.
Source: Tradingview, NYMEX, FOREX.com
Continue to watch the 58.00 level for WTI. It has proved to be good support in the near term. In addition, notice that moves higher since the beginning of the year due to geo-political events have tended to be faded. Is this a trend? Also, as mentioned in our Oil week ahead write up, Davos begins this week on Wednesday. Watch for comments which may be market moving. We also have the usually weekly API and DOE data due out Wednesday and Thursday, respectively (delayed 1 day due to the US holiday).
Related tags:
Latest market news




Open an account in minutes
Experience award-winning platforms with fast and secure execution, and enjoy tight spreads from 0.5 pts on FX and 0.3 pts on indices.
Economic calendar
Web Trader platform
Our sophisticated web-based platform is packed with features.
Related articles
Euro Forecast: EUR/USD Tumbles Towards Yearly Low as Daily RSI Goes Oversold
EUR/USD has been hit hard in the final month of the quarter as USD strength has shown up in a big way. With the pair set to challenge its yearly low as RSI has pushed into oversold territory, is there a chance for a pullback with some big headline risk hitting in the US over the next few days?
AUD/USD outlook: Aussie slips despite hawkish RBA ahead of key data
The AUD/USD was unable to benefit from the Reserve Bank of Australia’s 25-basis-point rate hike overnight. The RBA lifted the cash rate to 4.60%, in line with expectations. However, the Australian dollar weakened following the decision, with much of the Bank’s hawkish stance seemingly priced in ahead of the announcement. The US dollar has also remained largely supported following the recent turmoil in the bond markets.

Canadian Dollar Technical Outlook: USD/CAD Seven-Day Rally Tests Major Resistance 9 29 2026
USD/CAD is pressing into a major technical barrier after an extended advance, raising the risk for price inflection as momentum stretches.

This report is intended for general circulation only. It should not be construed as a recommendation, or an offer (or solicitation of an offer) to buy or sell any financial products. The information provided does not take into account your specific investment objectives, financial situation or particular needs. Before you act on any recommendation that may be contained in this report, independent advice ought to be sought from a financial adviser regarding the suitability of the investment product, taking into account your specific investment objectives, financial situation or particular needs.
StoneX Financial Pte. Ltd., may distribute reports produced by its respective foreign entities or affiliates within the StoneX group of companies or third parties pursuant to an arrangement under Regulation 32C of the Financial Advisers Regulations. Where the report is distributed to a person in Singapore who is not an accredited investor, expert investor or an institutional investor (as defined in the Securities Futures Act), StoneX Financial Pte. Ltd. accepts legal responsibility to such persons for the contents of the report only to the extent required by law. Singapore recipients should contact StoneX Financial Pte. Ltd. at 6826 9988 for matters arising from, or in connection with the report.
In the case of all other recipients of this report, to the extent permitted by applicable laws and regulations neither StoneX Financial Pte. Ltd. nor its associated companies will be responsible or liable for any loss or damage incurred arising out of, or in connection with, any use of the information contained in this report and all such liability is hereby expressly disclaimed. No representation or warranty is made, express or implied, that the content of this report is complete or accurate.
StoneX Financial Pte. Ltd. is not under any obligation to update this report.
Trading CFDs carries a high level of risk that may not be suitable for some investors. Consider your investment objectives, level of experience, financial resources, risk appetite and other relevant circumstances carefully. The possibility exists that you could lose some or all of your investments, including your initial deposits. If in doubt, please seek independent expert advice. Visit www.forex.com/en-sg/terms-and-policies for the complete Risk Disclosure Statement.