


Euro Forecast: EUR/USD Tumbles Towards Yearly Low as Daily RSI Goes Oversold
EUR/USD has been hit hard in the final month of the quarter as USD strength has shown up in a big way. With the pair set to challenge its yearly low as RSI has pushed into oversold territory, is there a chance for a pullback with some big headline risk hitting in the US over the next few days?
Share this:

EUR/USD, Euro Talking Points:
- It’s been a one-way move for EUR/USD since a week before the Fed’s rate hike, as the pair has dropped by more than 300 pips and is now nearing a re-test of the yearly low that was set back in June.
- Longer-term, the pair has been showing tendency of mean reversion for the past 15 months and during that time, overbought and oversold reads via daily RSI have highlighted inflection points for several swings. The indicator just went into oversold territory for the first time since that June low.
The proverbial rubber band is pulled back across several USD pairs as DXY has continued a strong rally over the past three weeks. The Fed rate decision has certainly played a role, although that rate hike was largely expected even before then. But perhaps the tone from the Fed towards another hike is what caught markets by surprise and to be sure, there’s now a building probability for two more hikes as we go into the end of the year.
From that perspective, it’s also the run in Treasury yields that’s contributing to a degree, as a Fed that’s not perceived as serious in their inflation fight gives investors even fewer reasons to hold duration. After all, would you want to hold debt for 10 years at a 5% rate if inflation was expected to maintain at 3.5% or more? And what if the Fed was cavalier in shrugging that off, instead, looking to cut rates to stimulate business investment. Well, there would be even less reason to want to hold that debt.
This is often a misunderstood and mis-diagnosed relationship across markets as particpants will often want to tie one thing to the other, positing that weakness in bonds should mean weakness in the currency but one look at a correlation coefficient shows that the relationship is far less consistent than that. It’s situational, such as we have now, and it’s also one of comparison when we’re talking about currencies because the asset class is so unique.
The only way to value a currency – is with another currency – and in a pair like EUR/USD that relationship is quite clear. But, for the past 15 months, by and large, that relationship has been fairly consistent, even with the constant pushing from the Trump administration in trying to coax a weaker Dollar.
EUR/USD Weekly Chart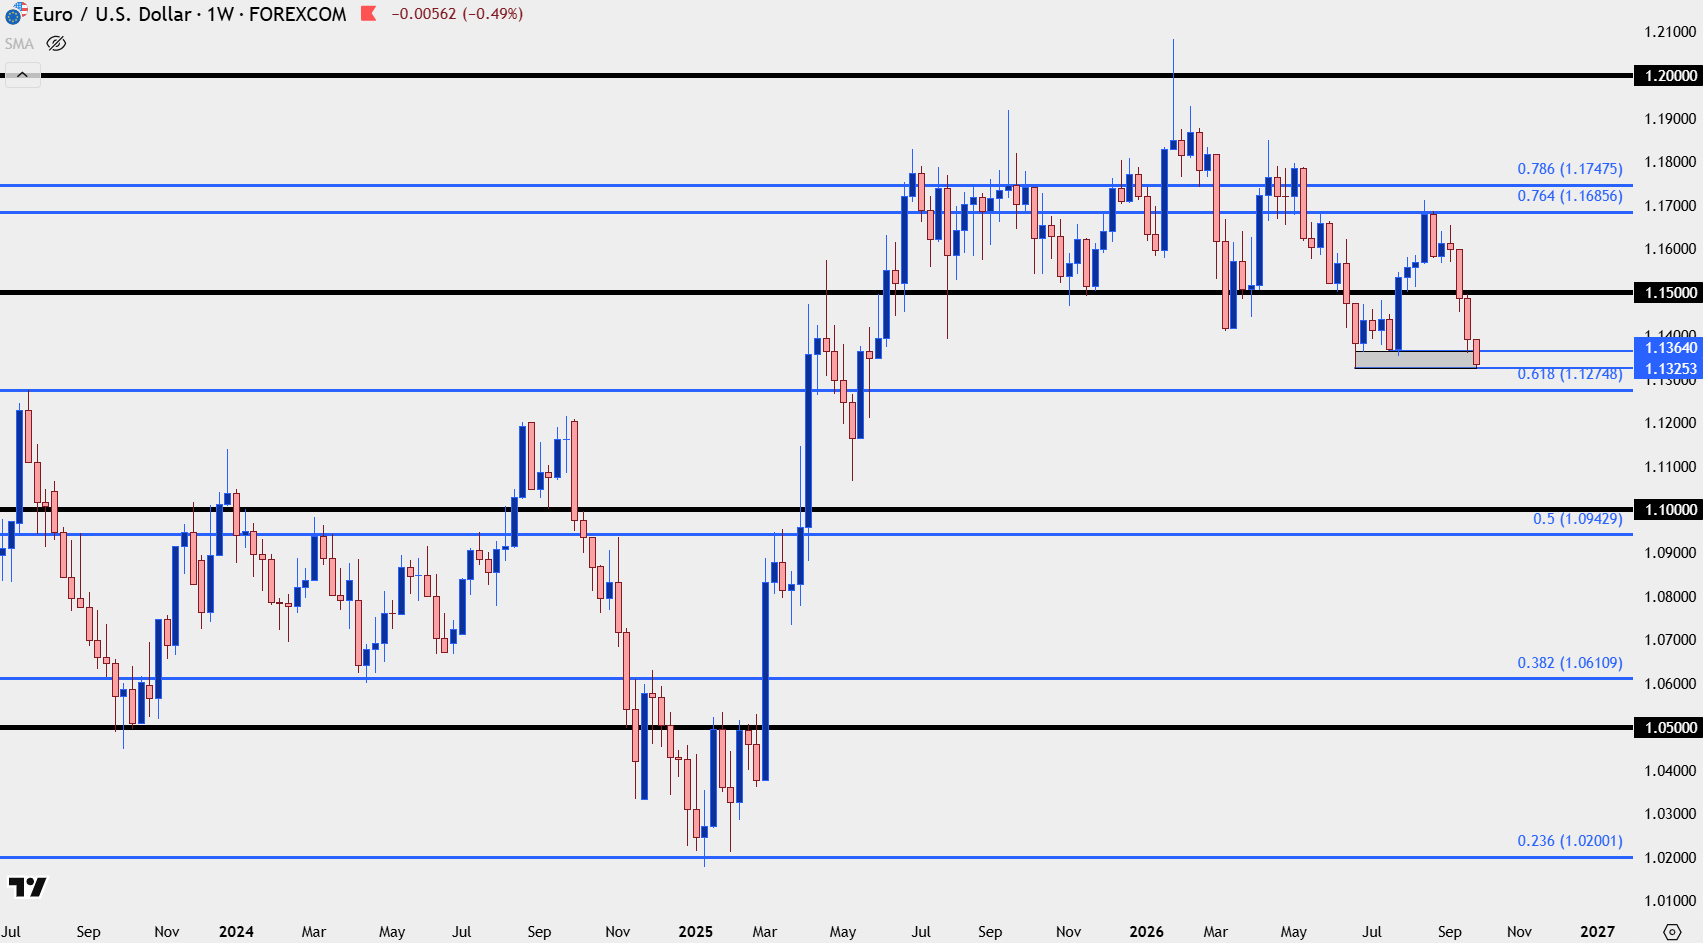
Chart prepared by James Stanley; data derived from Tradingview
EUR/USD Oversold
At this point, the RSI indicator is at its most oversold since March on the daily chart. And I’m not a big ‘RSI as a timing indicator’ type of person, as it’s simply a lagging indicator and the past is not predictive of the future. But – it does provide important context, and it helps to point out market extremes. Since the mean-reversion in EUR/USD began around the second half of last year, there’s been a handful of overbought or oversold moves via RSI, and most have shown near inflections of local highs or lows that preceded a swing in the other direction.
This does not mean that each RSI 30 or 70 cross will pan out the same and I’ve added two in dashed red vertical lines towards the left of the chart that shows when this did not happen. But – if a trader is looking at fading this recent run of USD-strength, or if the trader anticipates this mean-reverting backdrop to continue, this can be valuable information that can serve as the initial inkling for a trade idea.
At this point, the RSI indicator would need to cross back above 30 to bring this to fruition so that would mean a day or two of relative strength.
EUR/USD Daily Price Chart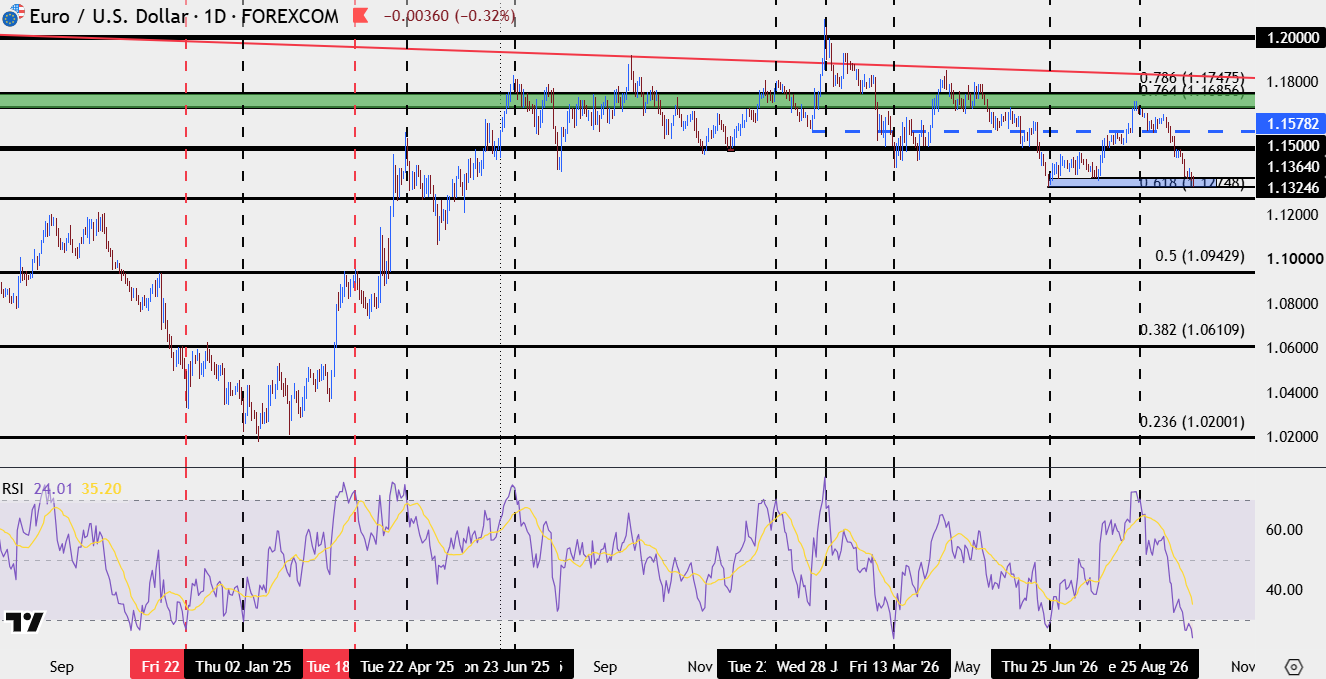
Chart prepared by James Stanley; data derived from Tradingview
EUR/USD Falling Knives
At this point EUR/USD is in a fast descent towards the yearly low, which was set back in June at 1.1325. Notably, there was a higher-low set in July at 1.1364, and that had provided a bounce last week that, so far, has been faded. Longs at this point would be akin to trying to catch a falling knife.
What could possibly present a setup on shorter-terms is a probe of a fresh low, followed by failure from sellers to follow-through. An exposed underside wick could illustrate that possibility and as we go into some heavy event risk later this week, with Core PCE and NFP dominating the calendar, this could present a compelling backdrop to start looking for mean reversion, particularly if that pairs with a crossover on daily RSI of the 30-level.
EUR/USD Four-Hour Chart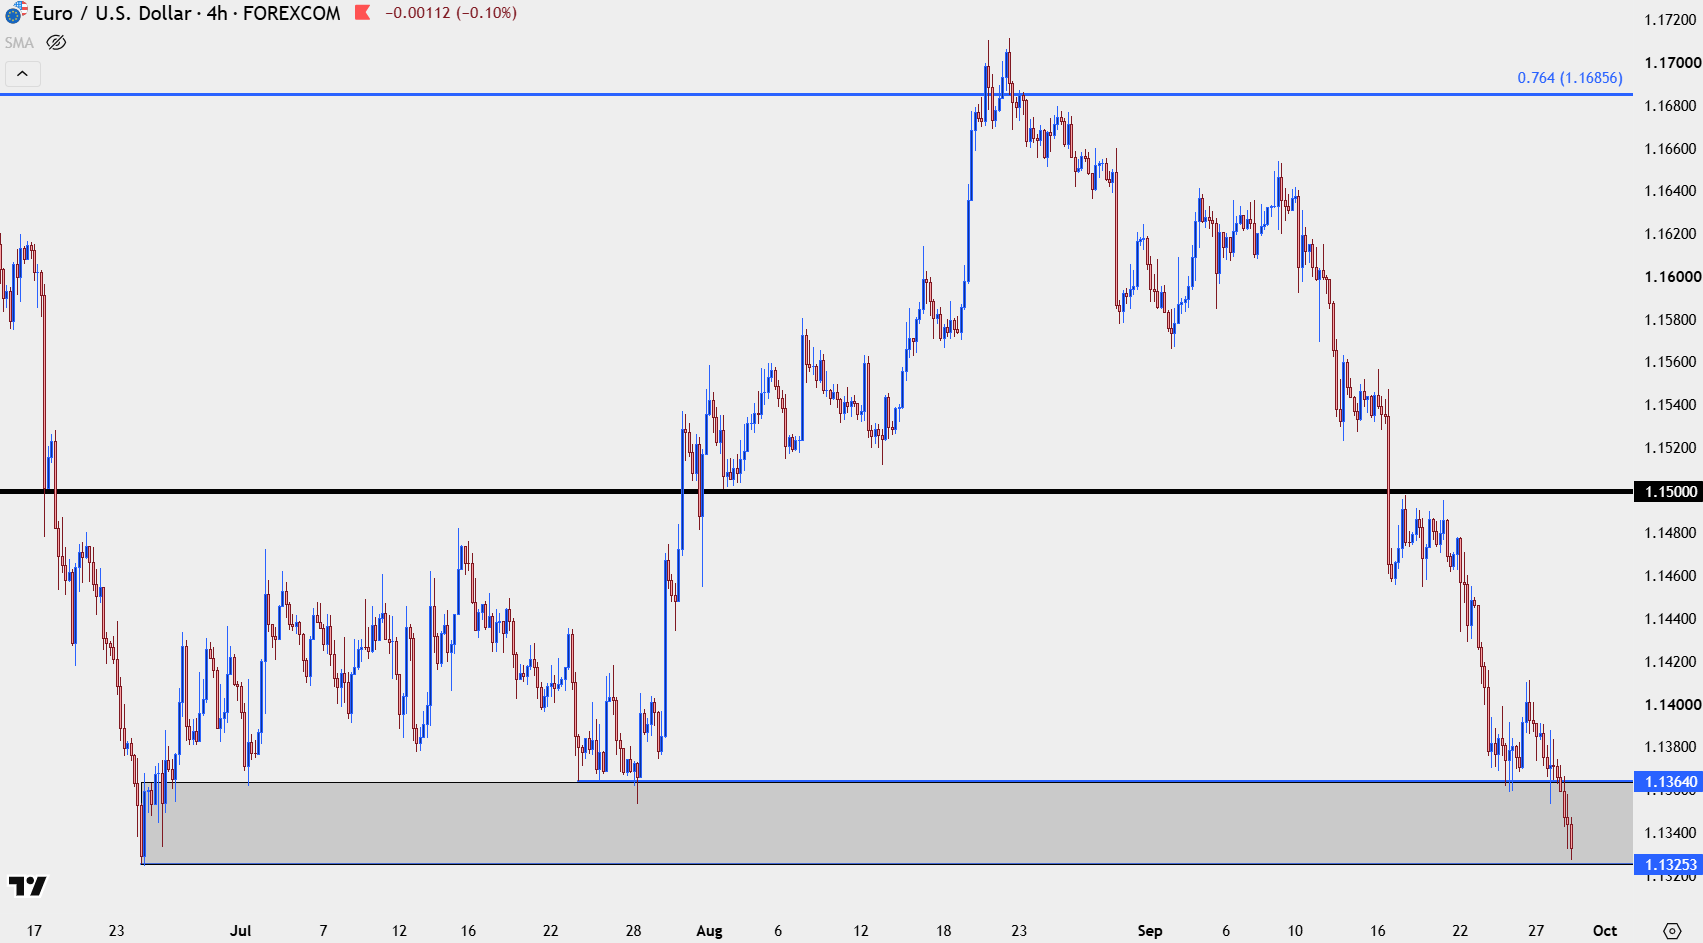
Chart prepared by James Stanley; data derived from Tradingview
--- written by James Stanley, Senior Market Analyst, Global Macro
Related tags:


Open an account in minutes
Experience award-winning platforms with fast and secure execution, and enjoy tight spreads from 0.5 pts on FX and 0.3 pts on indices.
Economic calendar
Web Trader platform
Our sophisticated web-based platform is packed with features.
Related articles
Gold Breaks Down on Descending Triangle, Sets Up $4k Test
Gold started last week with a strong sell-off but from that move a bounce developed. Bulls could not hold on through the weekly close, however, and the bearish structure remains in-place for XAU/USD.

USD/JPY weekly outlook: Quarter turn scrambles rates regime
USD/JPY’s tight relationship with front-end US rates broke down sharply last week, but quarter-turn flows and positioning suggest the disconnect may prove temporary.


USD/CAD forecast: rally could accelerate above June highs at 1.4250
USD/CAD recovered quickly after weaker US jobs data, keeping the bullish trend in focus. A move above the June highs could accelerate the rally as inflation keeps the Fed under pressure.

This report is intended for general circulation only. It should not be construed as a recommendation, or an offer (or solicitation of an offer) to buy or sell any financial products. The information provided does not take into account your specific investment objectives, financial situation or particular needs. Before you act on any recommendation that may be contained in this report, independent advice ought to be sought from a financial adviser regarding the suitability of the investment product, taking into account your specific investment objectives, financial situation or particular needs.
StoneX Financial Pte. Ltd., may distribute reports produced by its respective foreign entities or affiliates within the StoneX group of companies or third parties pursuant to an arrangement under Regulation 32C of the Financial Advisers Regulations. Where the report is distributed to a person in Singapore who is not an accredited investor, expert investor or an institutional investor (as defined in the Securities Futures Act), StoneX Financial Pte. Ltd. accepts legal responsibility to such persons for the contents of the report only to the extent required by law. Singapore recipients should contact StoneX Financial Pte. Ltd. at 6826 9988 for matters arising from, or in connection with the report.
In the case of all other recipients of this report, to the extent permitted by applicable laws and regulations neither StoneX Financial Pte. Ltd. nor its associated companies will be responsible or liable for any loss or damage incurred arising out of, or in connection with, any use of the information contained in this report and all such liability is hereby expressly disclaimed. No representation or warranty is made, express or implied, that the content of this report is complete or accurate.
StoneX Financial Pte. Ltd. is not under any obligation to update this report.
Trading CFDs carries a high level of risk that may not be suitable for some investors. Consider your investment objectives, level of experience, financial resources, risk appetite and other relevant circumstances carefully. The possibility exists that you could lose some or all of your investments, including your initial deposits. If in doubt, please seek independent expert advice. Visit www.forex.com/en-sg/terms-and-policies for the complete Risk Disclosure Statement.