






12660 remains pivotal for GBPCHF
With a bearish structure on the weekly chart and potential H&S top on the daily, we’re looking for an eventual breakdown.
Share this:

With a bearish structure on the weekly chart and potential H&S top on the daily, we’re looking for an eventual breakdown.
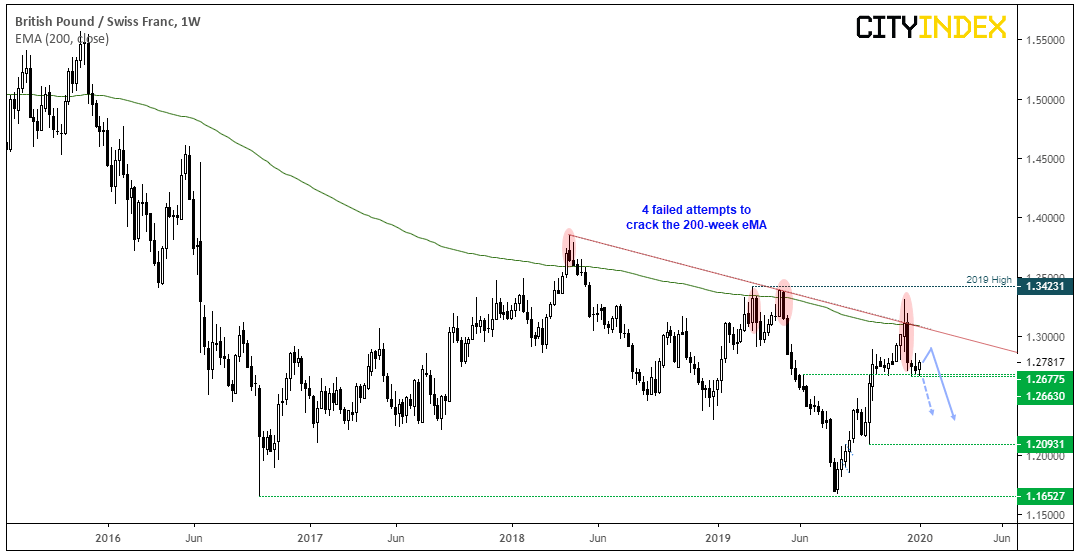
We can see on the weekly chart that GBP/CHF remains in a long-term bearish trend. There have also been four failed attempts to break above the 200-week eMA, with the most recent attempt being the week of the UK elections in December. Given the following week was a bearish engulfing candle and its most bearish in 5 months, it’s possible the market has topped.
However, we’d need to see a clear break of the 1.2660 before assuming trend continuation, which leaves it vulnerable to a bounce beforehand.
Switching to the daily chart, GBP/CHF has found support above the June high along with the 100 and 200-day eMA’s. With the 100 above the 200 eMA and sloping higher, there’s potential for a bounce over the near-term. Therefor bulls may want to consider trading the range and entering close to the lows around 1.2700 and target the zone of resistance around 1.2855 / 93.
However, if momentum wanes near the highs and signals price action is trying to top out, then bears could look to fade into moves below the resistance zone. Due to the bearish structure of the weekly chart, an eventual break lower is favoured. So we’re on the lookout for a break below 1.2600 as this would clear the current range and the 100 and 200-day eMA’s.
- Whilst prices remain between 1.2663 – 1.2890, range trading strategies are preferred (long at the lows, short at the highs)
- A break below 1.2660 confirms a head and shoulders top (and also clears the 100 and 200-day eMA’s)
- If successful, the H&S projects an approximate target around 1.2200.
With a bearish structure on the weekly chart and potential H&S top on the daily, we’re looking for an eventual breakdown.
We can see on the weekly chart that GBP/CHF remains in a long-term bearish trend. There have also been four failed attempts to break above the 200-week eMA, with the most recent attempt being the week of the UK elections in December. Given the following week was a bearish engulfing candle and its most bearish in 5 months, it’s possible the market has topped.
However, we’d need to see a clear break of the 1.2660 before assuming trend continuation, which leaves it vulnerable to a bounce beforehand.
Switching to the daily chart, GBP/CHF has found support above the June high along with the 100 and 200-day eMA’s. With the 100 above the 200 eMA and sloping higher, there’s potential for a bounce over the near-term. Therefor bulls may want to consider trading the range and entering close to the lows around 1.2700 and target the zone of resistance around 1.2855 / 93.
However, if momentum wanes near the highs and signals price action is trying to top out, then bears could look to fade into moves below the resistance zone. Due to the bearish structure of the weekly chart, an eventual break lower is favoured. So we’re on the lookout for a break below 1.2600 as this would clear the current range and the 100 and 200-day eMA’s.
- Whilst prices remain between 1.2663 – 1.2890, range trading strategies are preferred (long at the lows, short at the highs)
- A break below 1.2660 confirms a head and shoulders top (and also clears the 100 and 200-day eMA’s)
- If successful, the H&S projects an approximate target around 1.2200.
Related tags:




The complete CFD trading experience
Award-winning platforms, competitive spreads, low commissions and dedicated support.
We live and breathe the markets and are dedicated to helping traders realise their ambitions as we continue to set the industry bar.
Economic calendar
Web Trader platform
Our sophisticated web-based platform is packed with features.
Related articles
StoneX Europe Ltd may make third party material available on this website which may contain information included but not limited to the conditions of financial markets. The material is for information purposes only and does not contain, and should not be construed as containing, investment advice and/or investment recommendation and/or an investment research and/or an offer of or solicitation for any transactions in financial instruments; any decision to enter into a specific transaction shall be made by the client following an assessment by him/her of their situation.
StoneX Europe Ltd makes no representation or warranty and assumes no liability as to the accuracy or completeness of the information provided, nor any loss arising from any investment based on a recommendation, forecast or other information supplied. You should always seek independent advice as to your suitability to speculate in any related markets and your ability to assume the associated risks, if you are at all unsure. We are not under any obligation to update any such material. Any opinion made may be personal to the author and may not reflect the opinion of StoneX Europe Ltd.