



Japanese Yen Technical Analysis: USD/JPY Support Test into Core PCE
USD/JPY has been a battlefield for the past two months as the force of intervention and the threat of more have given sellers an advantage, even as buyers have continued to bid support on pullbacks. This sets the stage for a massive finish to the week with Core PCE and Non-farm Payrolls.
Share this:

USD/JPY Talking Points:
- It’s been a dichotomous backdrop in USD/JPY, as longer-term charts illustrate a clear shift into a more bearish backdrop but on a shorter-term look, bulls have continued to pile in after pullbacks.
- Last week saw a resistance test at 159 and that drove a pullback to a support level at 156.68. That level gave a 100+ pip bounce yesterday, but noticeably, bulls haven’t continued the push. A heavy dose of data in the back-half of the week may have something to do with that.
One look at the weekly chart and it’s clear that a shift has shown up recently in the USD/JPY pair. And, really, over the past five years there’s been a similar push-pull dynamic of ‘up the stairs, down the elevator.’
That can largely be drawn back to positioning, as a crowded trade sees incremental gains on the way up, with buyers testing and testing as each fresh high prints; while the exit door brings a furious retracement driven by the prospect of change. In 2022, 2023 and 2024, that change was in the form of weakening inflation hitting Fed rate hike and then rate cut expectations. More recently, since July, that’s been due to a dual intervention from the U.S. and Japan.
But, as I pointed out after that first intervention run, when prices were pushing towards the 155.00 level, there was still motive for longs and through the month of August, that’s what showed up as buyers pushed all the way back to the 160.00 level. Another swing developed shortly after that and this time, prices pushed down to the 153 level. And, again, buyers loaded up and prices ran for 600 pips until last week’s test and stall at the 159.00 level.
USD/JPY Daily Chart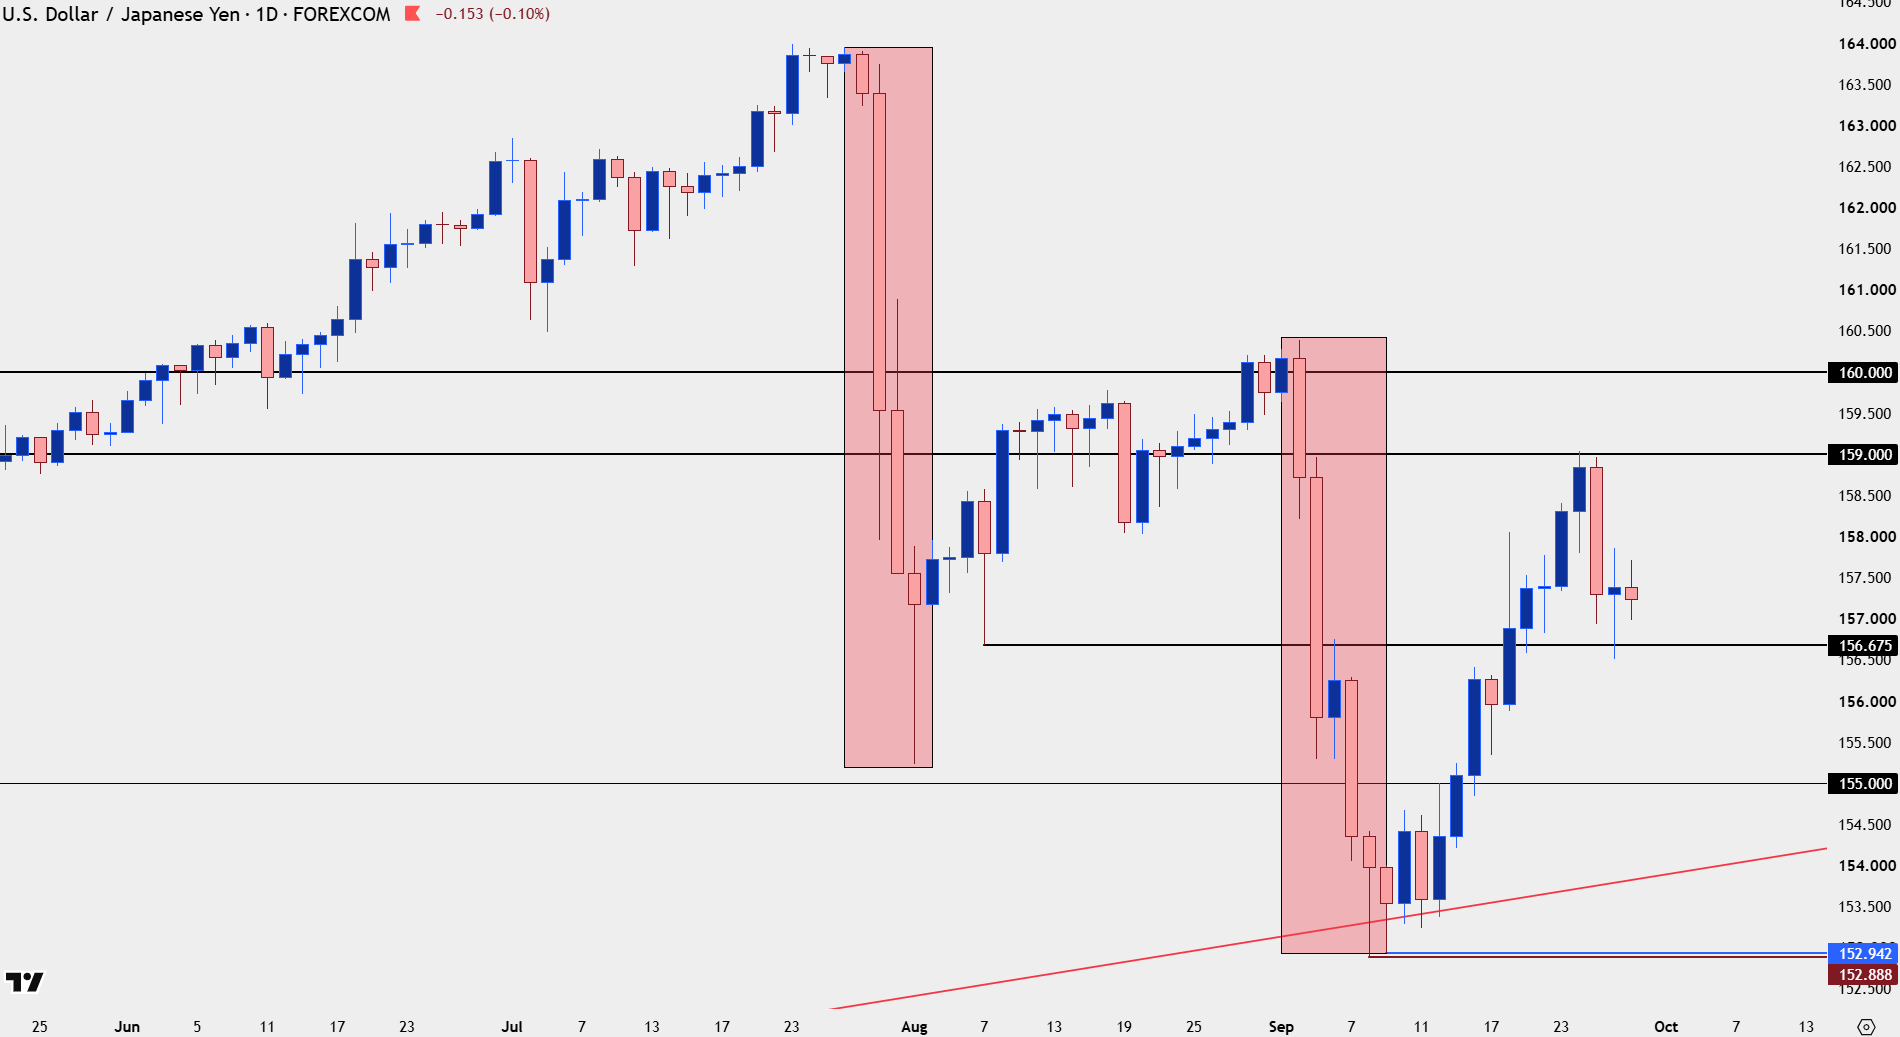
Chart prepared by James Stanley; data derived from Tradingview
USD/JPY Shorter-Term
Last week saw both the US and Japan comment on Japanese spot rates, which was one of the factors behind the 250+ pip retracement. And while both would surely like a lower spot rate, that’s been the case for the past two months and perhaps the larger question is whether there’s enough fear of change in the environment to compel longer-term bulls to pare positions.
After all, this was what was behind retracements in 2022, 2023 and 2024 – as weakening CPI drove the fear that the Fed would go less hawkish and then, eventually dovish into a rate cut. We haven’t quite had that situation of late as US inflation is expected to come in at 3.5% tomorrow, which still outpaces inflation in Japan.
There could be another factor, however, as Japan is more vulnerable to surging oil prices as they’re forced to import all of their oil, and a sliding Yen to go along with higher oil prices makes that threat of future inflation an even larger factor.
For tomorrow, however, the focus is much more to the point, as Core PCE in the United States will likely have some form of direct relationship on the pair, with stronger inflation leading to higher odds of more US rate hikes, which further exposes that deviation between the US and Japan.
At this point, USD/JPY is holding support at a key zone, the same 156.68 that was in-play late last week synced up to 157.22. From the daily above, this has an open door for bullish continuation. But – for those that are bearish there could be a justification that I’ll look at a little lower.
USD/JPY Four-Hour Price Chart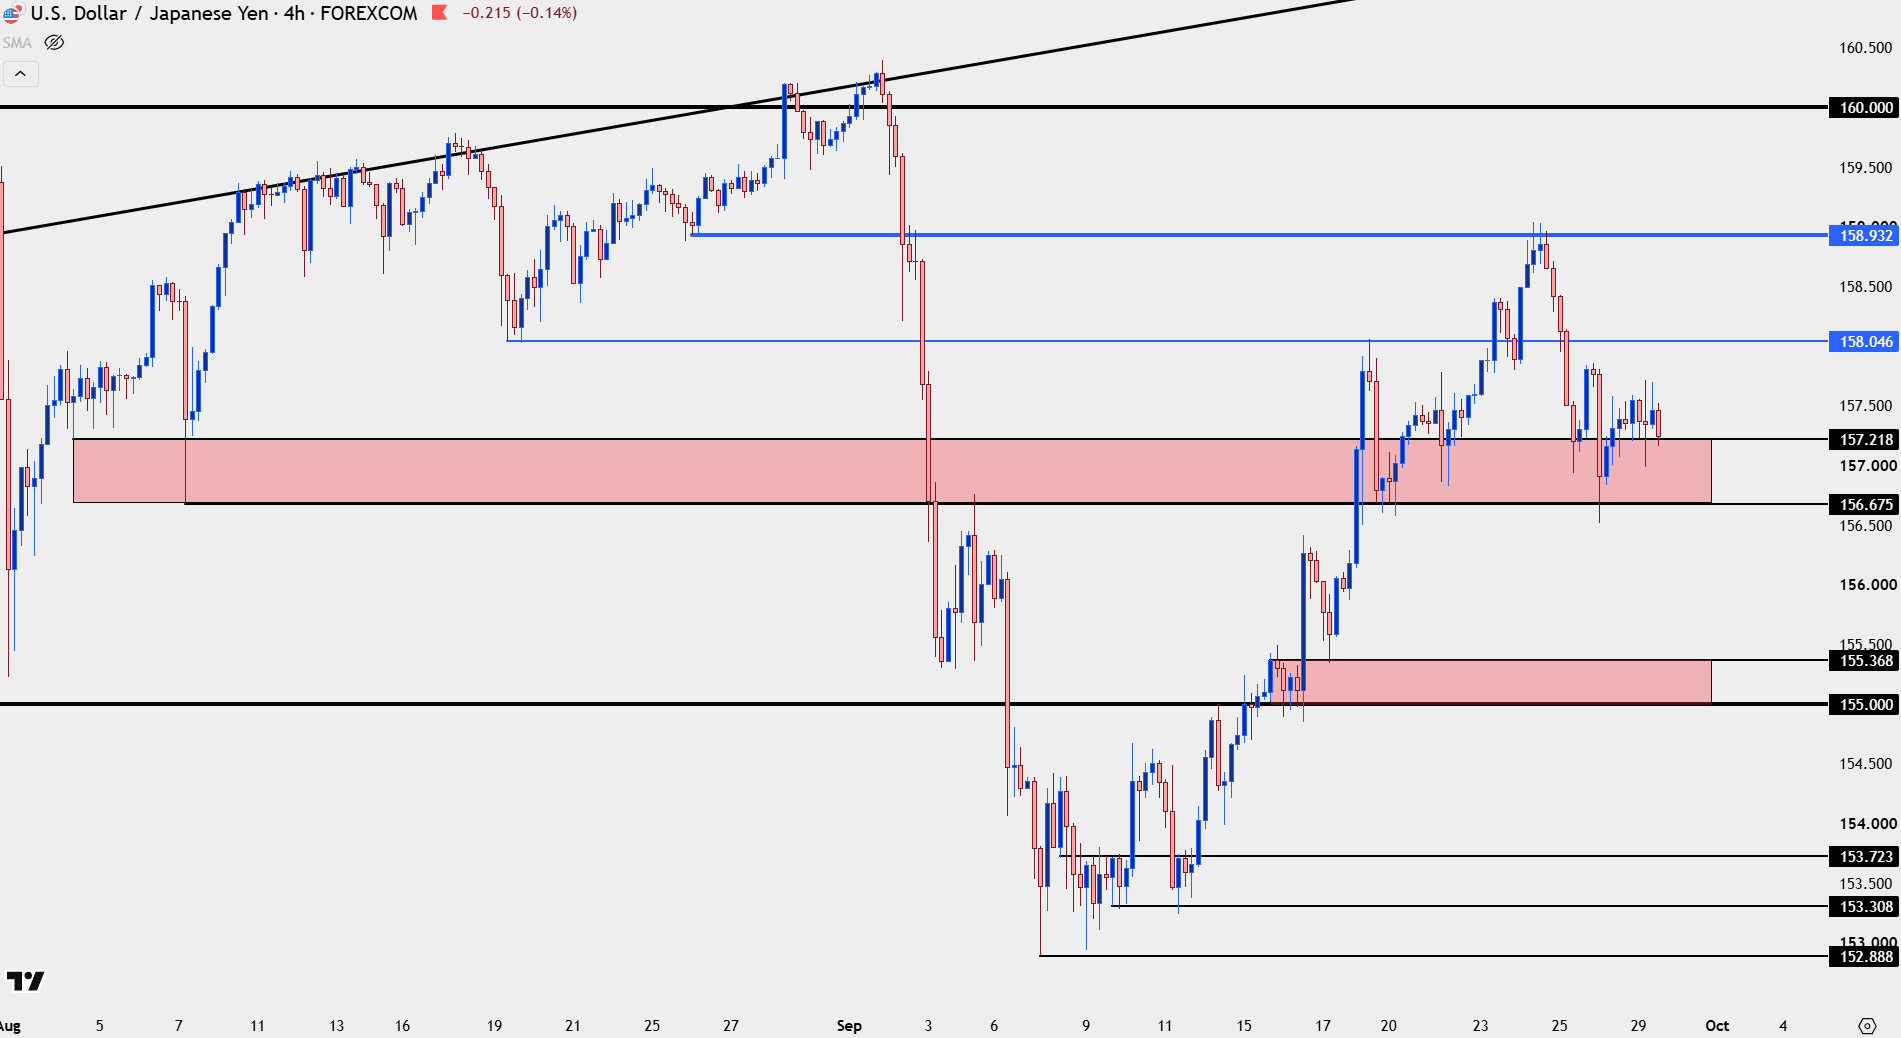
Chart prepared by James Stanley; data derived from Tradingview
USD/JPY Shorter-Term
At this point there’s a head and shoulders formation that’s set up on shorter-term charts. This would require a break of last week’s low to trigger, and if it does, that projects to a move of approximately 250 pips, which would point to around the 154 level on the pair.
USD/JPY Two-Hour Chart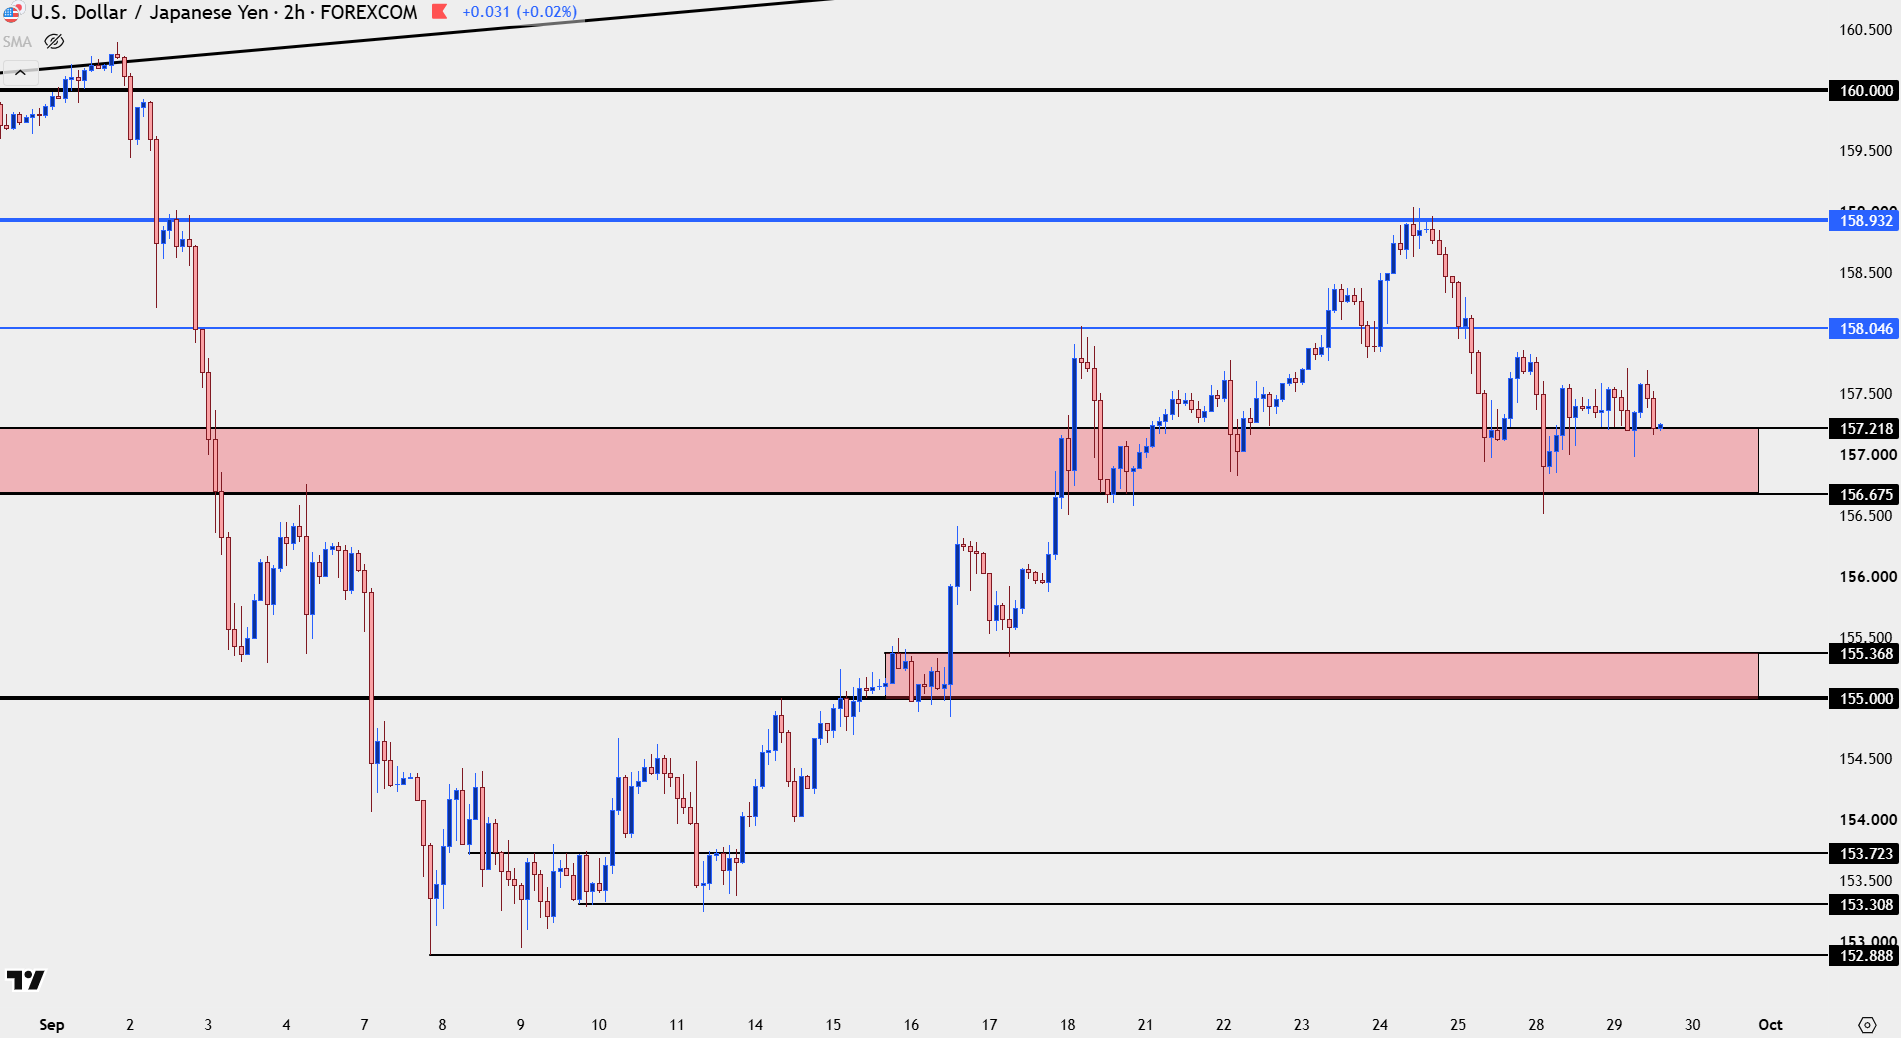
Chart prepared by James Stanley; data derived from Tradingview
--- written by James Stanley, Senior Market Analyst, Global Macro
Related tags:



The complete CFD trading experience
Award-winning platforms, competitive spreads, low commissions and dedicated support.
We live and breathe the markets and are dedicated to helping traders realise their ambitions as we continue to set the industry bar.
Economic calendar
Web Trader platform
Our sophisticated web-based platform is packed with features.
Related articles
USD/JPY weekly outlook: Quarter turn scrambles rates regime
USD/JPY’s tight relationship with front-end US rates broke down sharply last week, but quarter-turn flows and positioning suggest the disconnect may prove temporary.

USD Sets Fresh Yearly High as EUR/USD Drops Dramatically, USD/JPY Stable
Well, it was a week of USD strength that wasn’t entirely pushed by USD/JPY, as a strong sell-off in EUR/USD has pushed the major pair to its most oversold state in a decade.

Gold Price Outlook: XAU/USD Resistance at $4200 Sets Up for NFP
It was a strong sell-off to start the week in gold and despite a Tuesday bounce, sellers are continuing to push following a resistance hit at the $4200 level.
StoneX Europe Ltd may make third party material available on this website which may contain information included but not limited to the conditions of financial markets. The material is for information purposes only and does not contain, and should not be construed as containing, investment advice and/or investment recommendation and/or an investment research and/or an offer of or solicitation for any transactions in financial instruments; any decision to enter into a specific transaction shall be made by the client following an assessment by him/her of their situation.
StoneX Europe Ltd makes no representation or warranty and assumes no liability as to the accuracy or completeness of the information provided, nor any loss arising from any investment based on a recommendation, forecast or other information supplied. You should always seek independent advice as to your suitability to speculate in any related markets and your ability to assume the associated risks, if you are at all unsure. We are not under any obligation to update any such material. Any opinion made may be personal to the author and may not reflect the opinion of StoneX Europe Ltd.