



Gold Price Outlook: XAU/USD Resistance at $4200 Sets Up for NFP
It was a strong sell-off to start the week in gold and despite a Tuesday bounce, sellers are continuing to push following a resistance hit at the $4200 level.
Share this:

Gold Talking Points:
- As yields surged gold tanked to start the week, and despite a softer-than-expected Core PCE report XAU/USD bears have continued to hit pullbacks.
- This sets the stage for NFP on Friday and, in gold, perhaps the bigger question is whether sellers can force a break below $4100 and a re-test of the hardened support from June and July at the $4k level.
Gold prices put in a sizable drop on Monday and this comes after the metal had previously held up fairly well despite Treasury yields surging along the curve over the past couple of weeks. While last week saw gold hold above the FOMC low, that price was taken out aggressively to start this week and, so far, sellers have swatted down rallies below that price.
On a shorter-term basis, this had built a bear flag formation on shorter time frames and sellers have pushed below the formation, opening the door for a re-test of the lows which are then followed by the $4100 level that was setting resistance back in July, before the breakout.
Gold Two-Hour Price Chart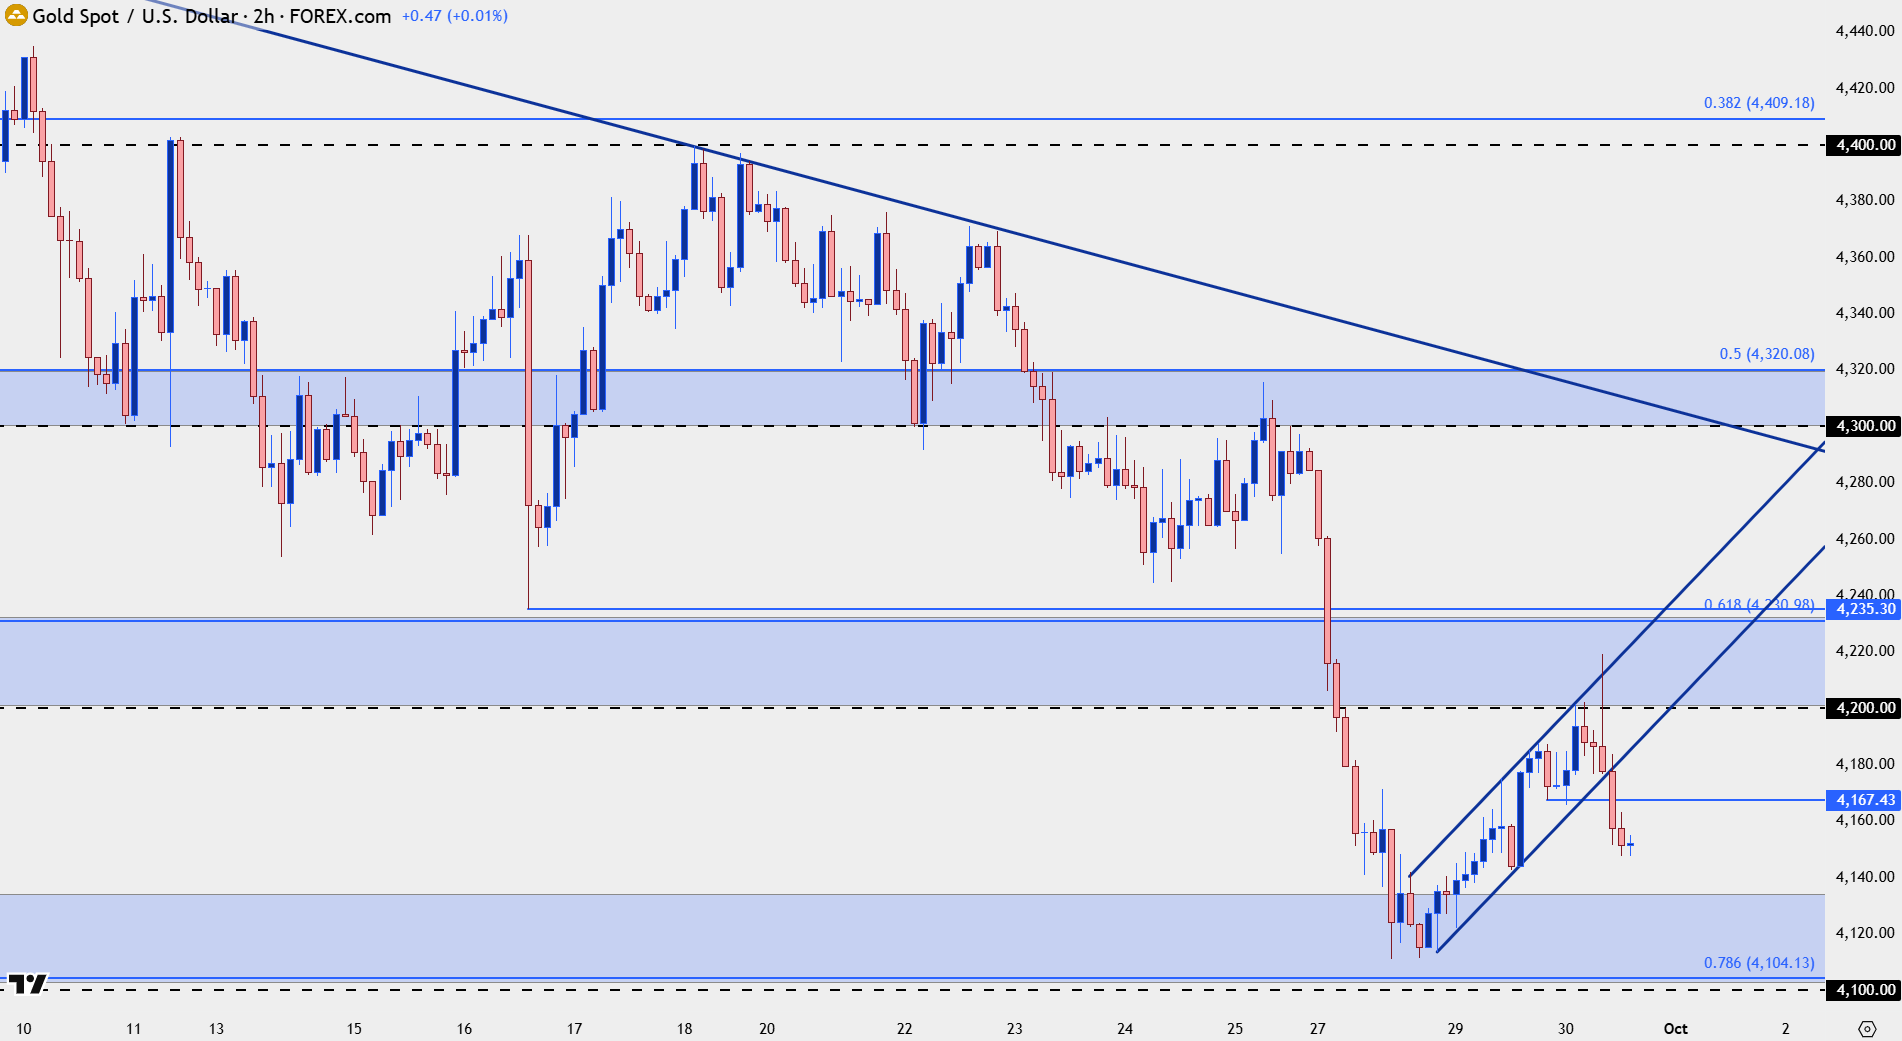
Chart prepared by James Stanley; data derived from Tradingview
Gold Descending Triangle Break
From the daily, we can see the descending triangle formation that had built ahead of the weekly open. That’s a bearish formation and the sell-off on Monday took out that support as price ran down to a fresh monthly low.
This further highlights bearish control and opens the door for sellers to take another swing-lower, with that $4k level standing out as the next spot of support underneath the $4100 zone.
Gold Daily Chart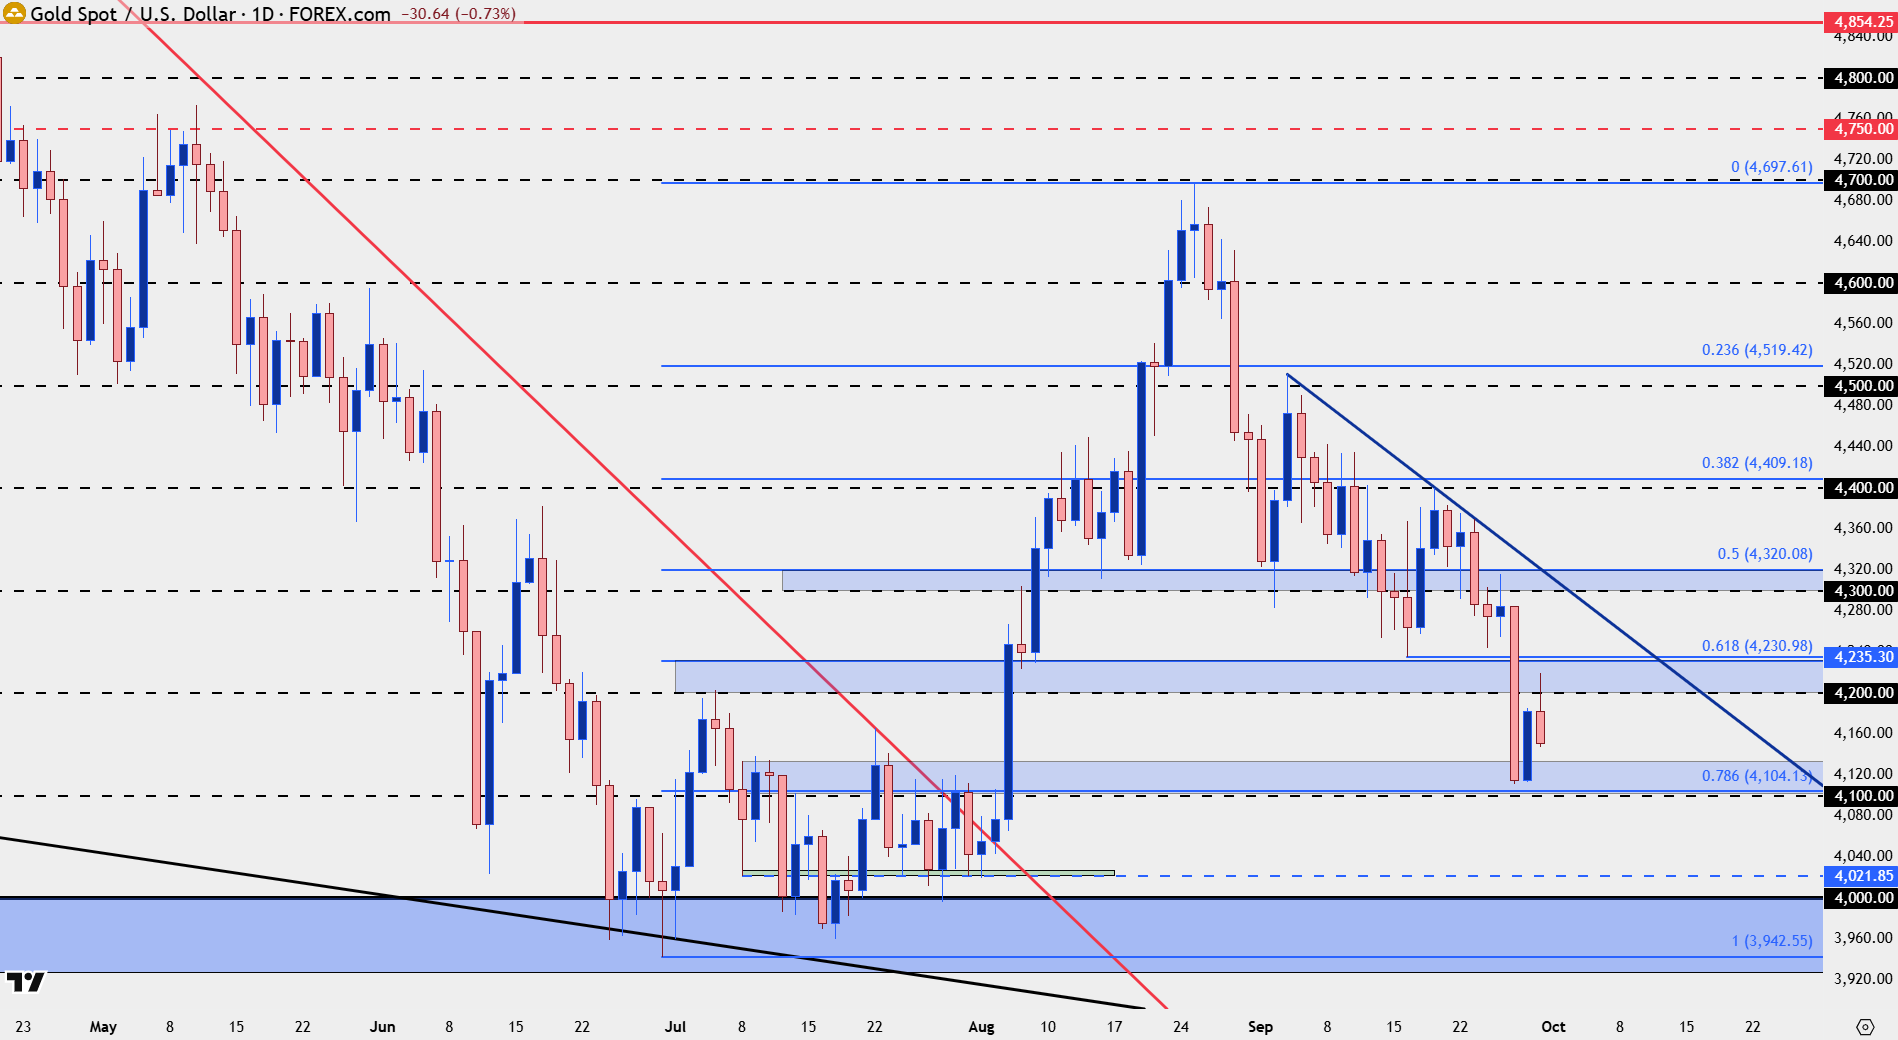
Chart prepared by James Stanley; data derived from Tradingview
Gold Big Picture: The $4k Line in the Sand
While the fundamental backdrop remains unfavorable for gold, the same could be said back in June or earlier in the year, as inflation expectations were flaring on the back of higher oil prices. That then drove rate expectations and that’s what brings us to our current backdrop, where we have both surging Treasury yields and hawkish expectations around the FOMC.
But, really, it was the support hold at the $4k level that coalesces the shorter and longer-term views, as that short-term weakness simply allowed for longer-term accumulation and from the weekly chart, we can see how incredibly important that $4k level remains to be.
This has a few different connotations: For bears with shorter-term strategies, this means that expecting a higher-low, at least on the first few breakdowns and tests near $4k, would probably be pretty prudent. If we do finally see the $4k level get taken out, that opens the door for $3500, and then $2790.
But – if we do see a higher-low above $4k, similar to what showed after the June FOMC meeting – followed by a build of lows and wicks on the weekly chart at that $4k handle – there could soon be a reversal to entertain.
Gold Weekly Chart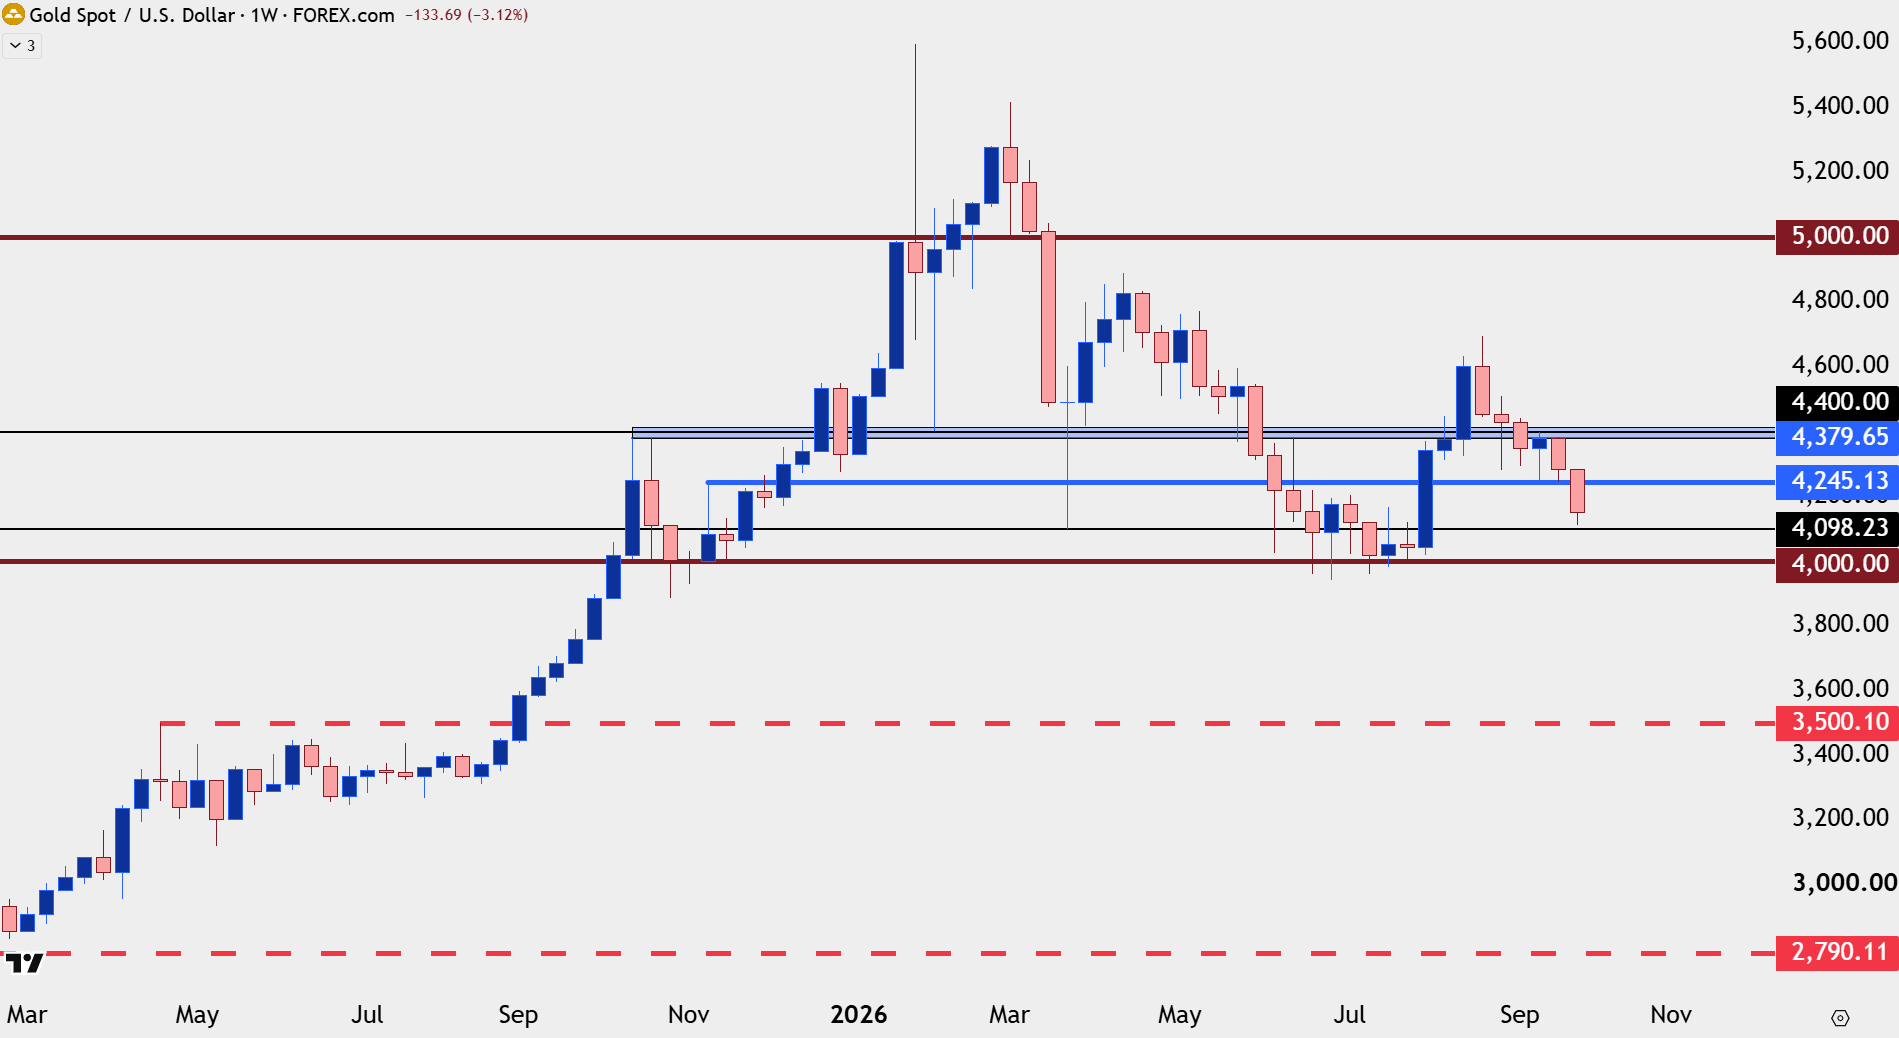
Chart prepared by James Stanley; data derived from Tradingview
--- written by James Stanley, Senior Market Analyst, Global Macro
Related tags:



The complete CFD trading experience
Award-winning platforms, competitive spreads, low commissions and dedicated support.
We live and breathe the markets and are dedicated to helping traders realise their ambitions as we continue to set the industry bar.
Economic calendar
Web Trader platform
Our sophisticated web-based platform is packed with features.
Related articles

Gold Price Forecast: XAU/USD Plunges 12.4% Toward Critical Support 10 1 2026
Softer inflation has revived expectations for a Fed pause, but Friday’s payrolls could put gold’s recovery prospects to the test.


Gold Price Outlook: XAU/USD Resistance at $4200 Sets Up for NFP
It was a strong sell-off to start the week in gold and despite a Tuesday bounce, sellers are continuing to push following a resistance hit at the $4200 level.

Nasdaq Breakout Potential into Q4 for Melt Up Scenarios
The headlines seem negative in almost any place that you look, with surging Treasury yields and frothy AI valuations getting more and more attention. But, if it’s so bad, why hasn’t the Nasdaq melted down yet, even as the Fed has started hiking rates?
StoneX Europe Ltd may make third party material available on this website which may contain information included but not limited to the conditions of financial markets. The material is for information purposes only and does not contain, and should not be construed as containing, investment advice and/or investment recommendation and/or an investment research and/or an offer of or solicitation for any transactions in financial instruments; any decision to enter into a specific transaction shall be made by the client following an assessment by him/her of their situation.
StoneX Europe Ltd makes no representation or warranty and assumes no liability as to the accuracy or completeness of the information provided, nor any loss arising from any investment based on a recommendation, forecast or other information supplied. You should always seek independent advice as to your suitability to speculate in any related markets and your ability to assume the associated risks, if you are at all unsure. We are not under any obligation to update any such material. Any opinion made may be personal to the author and may not reflect the opinion of StoneX Europe Ltd.