



Bitcoin Technical Forecast: Key Reversal or Breakdown?
Bitcoin’s price action has turned lively again, with the cryptocurrency staging a sharp intraday rebound after sliding to fresh lows earlier in the session. The move came alongside a broader risk recovery across equities, helped in part by improved market sentiment following Trump’s latest comments on China. Still, the technical picture remains on a knife’s edge as traders weigh whether this is a genuine reversal or merely a dead-cat bounce.
Share this:

- Bitcoin technical forecast: Watching the $107,250 level for a potential reversal or deeper decline
- A reclaim of $107,250 could form a hammer-like candle near the 200-day moving average — a bullish signal
- Failure to close above could expose Bitcoin to further downside, with $100,000 in sight
Bitcoin’s price action has turned lively again, with the cryptocurrency staging a sharp intraday rebound after sliding to fresh lows earlier in the session. The move came alongside a broader risk recovery across equities, helped in part by improved market sentiment following Trump’s latest comments on China. Still, the technical picture remains on a knife’s edge as traders weigh whether this is a genuine reversal or merely a dead-cat bounce.
Earlier in the day, Bitcoin broke below a key support level at $107,250, which had acted as a floor on at least three previous occasions. That breakdown triggered a wave of liquidations, flushing out weaker long positions and sending BTC tumbling to around $103,500 before the bulls managed to step in. Since then, Bitcoin has impressively clawed its way back, retesting the same $107,250 level — now a critical pivot zone for short-term direction.
Watching the Reclaim: Can Bitcoin Reverse Course?
If Bitcoin can reclaim and close decisively above $107,250, it could set up a powerful bullish reversal. Such a move would form a hammer-like candle on the daily chart — a pattern that often signals exhaustion in selling pressure and potential for a trend change. What makes this setup even more compelling is its proximity to the 200-day moving average, a widely watched gauge of long-term trend momentum.
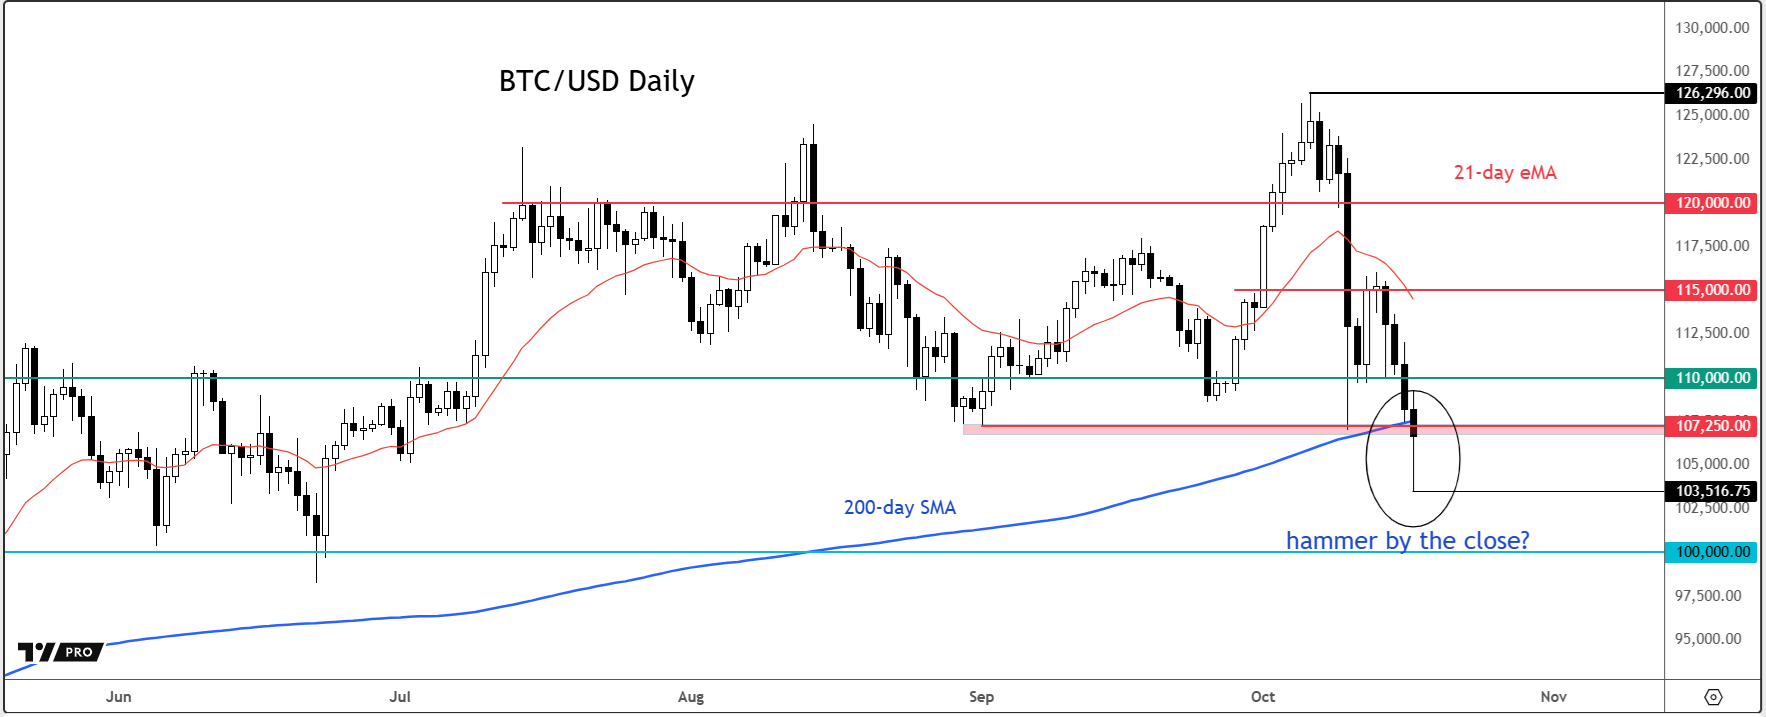
A clean daily close above both the 200-day MA and $107,250 on the BTCUSD chart would suggest that the recent breakdown was a false break, possibly trapping bears and fuelling a short-covering rally. In that case, momentum traders may start eyeing levels around $110,000 and $115,000 as near-term targets.
The Bearish Case: Resistance Holding Firm
However, if the $107,250 area now flips into resistance and Bitcoin fails to reclaim it by the end of the day, the bearish bias will remain intact. This would confirm the breakdown and suggest that market sentiment hasn’t fully healed yet, keeping pressure on the bulls.
In that scenario, the risk grows for an extended correction towards $100,000, with potential stops below that psychological level if momentum accelerates. The broader technical structure would then shift toward a lower-high, lower-low formation — a classic downtrend setup that could invite further selling from leveraged traders and algorithmic systems.
Key takeaway
In short, today’s close could prove pivotal for Bitcoin’s near-term trajectory. The $107,250 zone is shaping up as the battleground between bulls and bears — reclaim it, and BTC could stage a strong rebound from oversold levels; fail to do so, and the path toward $100K remains open.
For now, traders should keep an eye on how price action behaves around the 200-day moving average, as this confluence of technical factors often sets the tone for the next leg in Bitcoin’s journey.
-- Written by Fawad Razaqzada, Market Analyst
Follow Fawad on Twitter @Trader_F_R
How to trade with City Index
You can trade with City Index by following these four easy steps:
- Open an account, or log in if you’re already a customer
• Open an account in the UK
• Open an account in Australia
• Open an account in Singapore
- Search for the company you want to trade in our award-winning platform
- Choose your position and size, and your stop and limit levels
- Place the trade
Related tags:



The complete CFD trading experience
Award-winning platforms, competitive spreads, low commissions and dedicated support.
We live and breathe the markets and are dedicated to helping traders realise their ambitions as we continue to set the industry bar.
Economic calendar
Web Trader platform
Our sophisticated web-based platform is packed with features.
Related articles

Bitcoin Analysis: Is Uncertainty Returning to BTC?
Recent trading sessions have not been particularly supportive of a clear directional move in Bitcoin. This can be seen in the behavior of the price over the last four sessions, where fluctuations have remained close to 1.00% without establishing a consistent trend. As a result, a growing sense of neutrality is beginning to emerge around BTC.


Gold Dips Below Three-Month Uptrend, Bitcoin Pulls Back from Nine-Month High
Gold has dipped below its three-month uptrend, while Bitcoin has pulled back from a nine-month high as U.S. bond yields test levels last seen in 2004 and 2007. Risks build as Fed rate-hike expectations remain above 70%, while the Dollar Index holds near yearly highs.


Crypto Outlook: Altcoins Lead the Rally as Bitcoin Pauses
With only a few days left in September, the cryptocurrency market continues to show a constructive short-term outlook. The latest trading week has delivered meaningful gains across most major digital assets and, broadly speaking, the bullish bias remains the dominant force within the market.
StoneX Europe Ltd may make third party material available on this website which may contain information included but not limited to the conditions of financial markets. The material is for information purposes only and does not contain, and should not be construed as containing, investment advice and/or investment recommendation and/or an investment research and/or an offer of or solicitation for any transactions in financial instruments; any decision to enter into a specific transaction shall be made by the client following an assessment by him/her of their situation.
StoneX Europe Ltd makes no representation or warranty and assumes no liability as to the accuracy or completeness of the information provided, nor any loss arising from any investment based on a recommendation, forecast or other information supplied. You should always seek independent advice as to your suitability to speculate in any related markets and your ability to assume the associated risks, if you are at all unsure. We are not under any obligation to update any such material. Any opinion made may be personal to the author and may not reflect the opinion of StoneX Europe Ltd.