


BP Jump 4 On Dividend Increase Despite Falling Profits
BP shares are pushing higher in early trade after the oil major raised its dividend despite profits declining.
Share this:

BP shares are pushing higher in early trade after the oil major raised its dividend despite profits declining.
Results
Results
- Q4 earnings -26% to $2.6 billion vs $2.08 billion
- FY profits -21% $10 billion vs $12.7 billion 2018
- Dividend +2.4% to 10.50 cents per share
Falling energy prices
Higher production has failed to offset lower oil and gas prices. The average oil price across 2018 was $71 per barrel, whereas in 2019 this was down at $64 per barrel, an almost 10% difference – even with a 3% increase in production, there is no escaping that squeeze.
The results come following disappointing numbers from Shell, Exxon Mobil and Chevron as falling energy prices and reducing chemical industry margins hit the sector hard.
The price of oil has been under pressure already at the start of this year and could slip lower with the coronavirus outbreak potentially having a significant impact on demand for oil. Crude oil prices dived 15% across January and are already down 1.5% in February.
Divestment
BP is in the process of a $10 billion divestment programme to end 2020. The programme aims to reconfigure BP's portfolio of assets in order to strengthen the balance sheet following the BHP shale assets deal. Q4 Divestment totalled $800 million, in addition to $600 million from sale of 49% stake in Australian retail property portfolio.
BP impressed by saying that it was ahead of target and plans an additional $5 billion by mid-2021.
Debt
Since the BHP deal BP’s debt levels have come increasingly under the spotlight, gearing has fallen from 32% in Q3 to 31% in Q4 and is expected to move to mid-20% in 2020. There had been concerns that the higher debt levels could dampen prospects of cash being returned to investors. However, this fear doesn’t appear to be materialising.
Bob Dudley Steps Down
These were the last results with Bob Dudley at the helm; he leaves after 10 years a chief executive. Bernard Looney, head of exploration and production will take over. The timing seems fitting as BP looks to steers its course towards for sustainable forms of energy in a rapidly changing landscape.
Chart thoughts
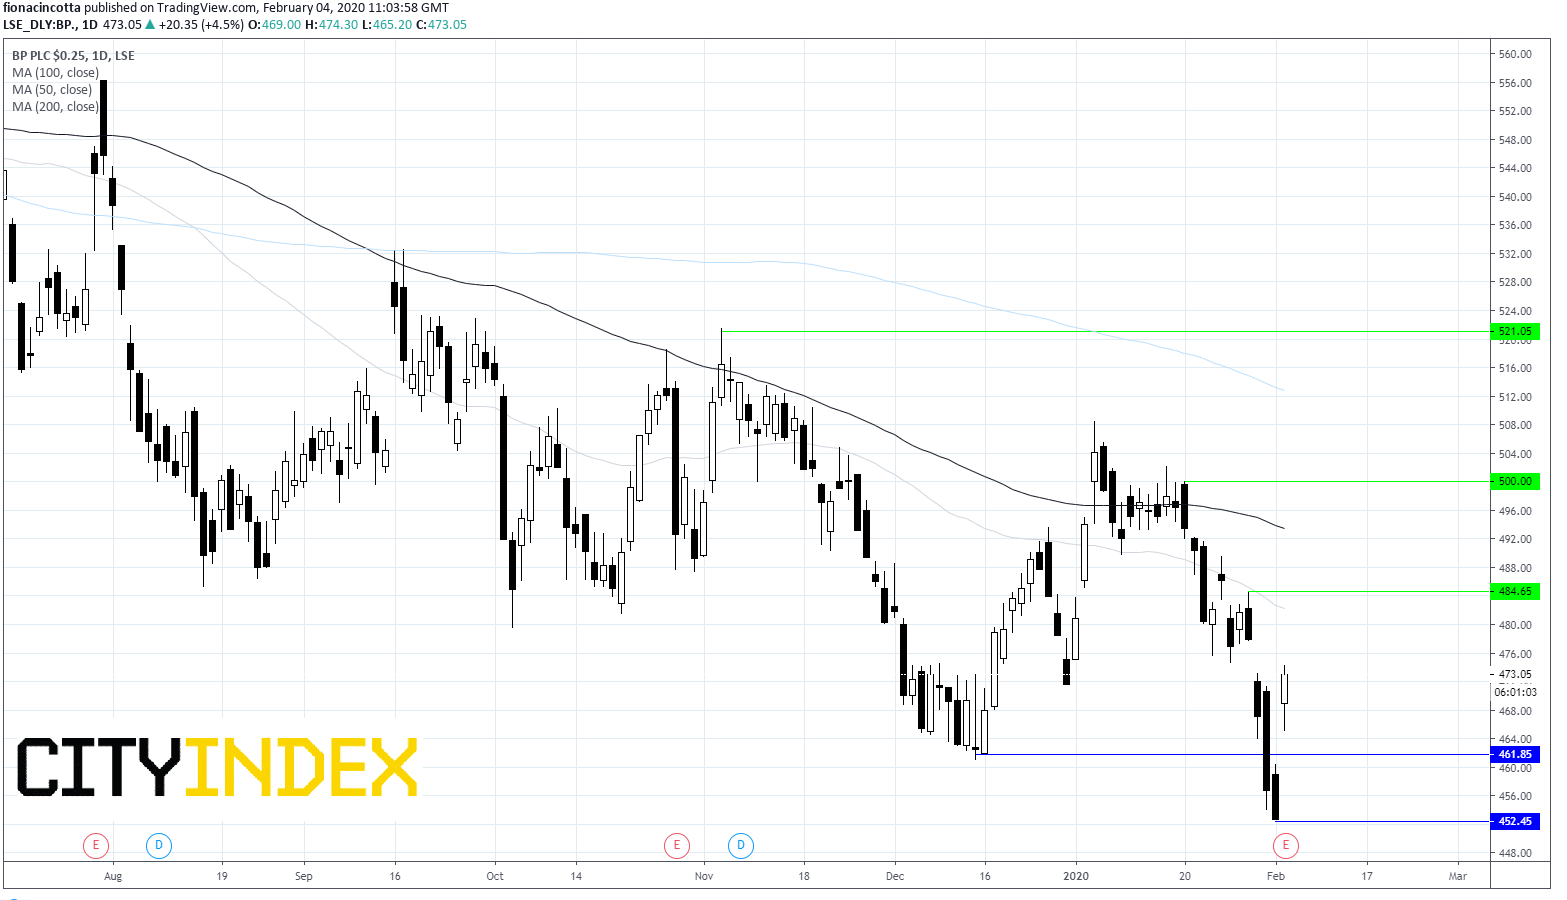
BP has jumped 4% higher in early trade on Tuesday. However BP continues trading below its 200, 100 on 50 sma on a bearish daily chart.
A break above resistance around 483-5p (29th Jan high, 50 sma) could negate the current bearish trend. Resistance is then at 500p (high 20th Jan) and 521p (5th Nov high).
Support can be seen at around 460p a level which provided support mid-December, before 452p, yesterday’s low.




The complete CFD trading experience
Award-winning platforms, competitive spreads, low commissions and dedicated support.
We live and breathe the markets and are dedicated to helping traders realise their ambitions as we continue to set the industry bar.
Economic calendar
Web Trader platform
Our sophisticated web-based platform is packed with features.
Related articles
Crude Oil Analysis: Geopolitical Risk Continues to Drive the WTI Barrel Higher
During recent trading sessions, a new wave of buying momentum has continued to gain relevance around WTI crude oil price action. Over the last three trading sessions, the market has maintained a bullish streak and is now up more than 5.5%, highlighting significant buying pressure in the short term.


Crude Oil Forecast WTI Prices Come Under Pressure as Middle East Risks Ease
Over the last two trading sessions, WTI crude oil has once again displayed a notable bearish bias, with prices falling nearly 6%. Part of this renewed selling pressure has been driven by recent developments in the Middle East, which have helped temporarily ease the geopolitical tensions that had supported the oil risk premium in previous weeks.

SK Hynix IPO: Everything You Need to Know About SK Hynix
Learn everything you need to know about the SK Hynix IPO, including its Nasdaq listing, valuation, financials, ownership, competitors and investment risks.

StoneX Europe Ltd may make third party material available on this website which may contain information included but not limited to the conditions of financial markets. The material is for information purposes only and does not contain, and should not be construed as containing, investment advice and/or investment recommendation and/or an investment research and/or an offer of or solicitation for any transactions in financial instruments; any decision to enter into a specific transaction shall be made by the client following an assessment by him/her of their situation.
StoneX Europe Ltd makes no representation or warranty and assumes no liability as to the accuracy or completeness of the information provided, nor any loss arising from any investment based on a recommendation, forecast or other information supplied. You should always seek independent advice as to your suitability to speculate in any related markets and your ability to assume the associated risks, if you are at all unsure. We are not under any obligation to update any such material. Any opinion made may be personal to the author and may not reflect the opinion of StoneX Europe Ltd.