





BTCUSD Will 2020 Bring Clear Vision to the Oldest Cryptocurrency
We recap the state of the Bitcoin network and look ahead to 2020
Share this:

This article is a complement to our full 2020 Market Outlook report - please download the full report for more insight into our views for major markets this year, including bold predictions from the research team!
To simplify, each of the last three years has had a distinct “theme” for the overall cryptoasset markets:
- 2017 was the peak mania/bubble period, especially in the 2nd half of the year.
- 2018 was the year the bubble popped, leading to deflating expectations and prices.
- 2019 was the year of recovery and “green shoots” for future use cases.
As we flip our calendars to 2020, the top question for traders and investors is whether the exciting technological groundwork laid in 2019 will pay dividends for investors, users, and developers.
State of the Crypto Market
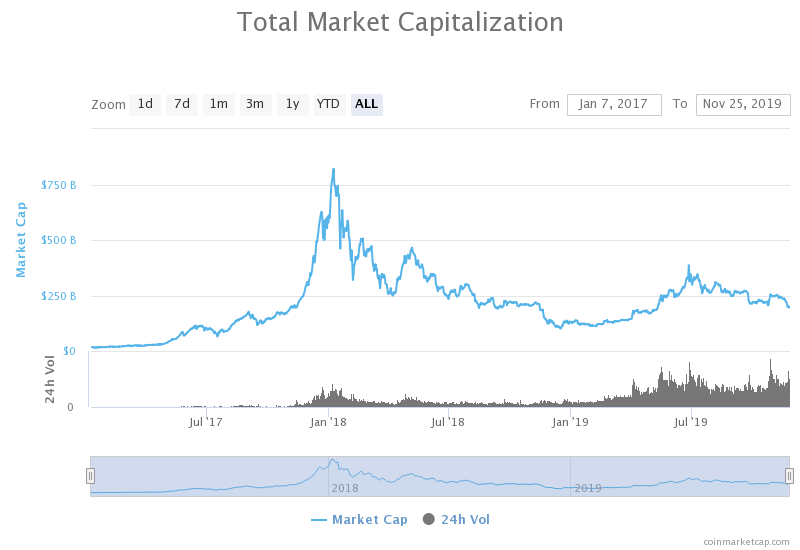
Far from the heady, halcyon days of late 2017, the cryptoasset markets are far tamer and more grounded as of writing in December 2019. After peaking above $800B at the start of 2018, the overall market capitalization of all the tokens in circulation has fallen to roughly $200B.
Source: CoinMarketCap
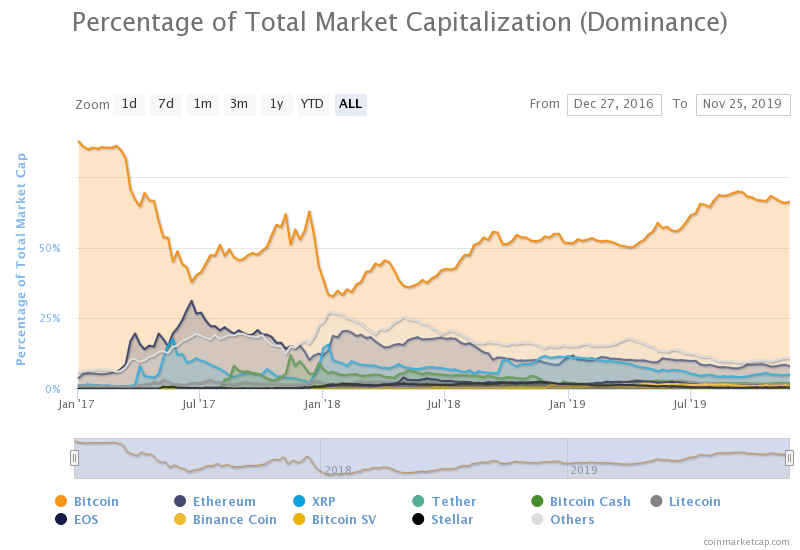
The majority of the “value” lost has come from so-called “altcoins” which include many of the overhyped ICO projects built in Ethereum’s smart contract ecosystem. While Bitcoin has been more than cut in half from its December 2017 peak, it’s fallen less than many competitors, leading to an increase in Bitcoin “dominance” or the portion of overall market value attributable to the original cryptocurrency.
Source: CoinMarketCap
As the chart above shows, Bitcoin now represents about two-thirds of the overall cryptoasset market capitalization, with rivals such as Ethereum, Ripple (XRP), and Bitcoin Cash losing market share. Generally speaking, the above chart can serve as an indicator of so-called “alt seasons”: when Bitcoin’s dominance is trending higher, crypto traders prefer to hold Bitcoin itself, whereas a turn lower in Bitcoin could signal that altcoins are poised to outperform.
Bitcoin’s relative outperformance from 2018-19 is poised to extend further in 2020
Bitcoin is scheduled for a “halving” of its block reward in mid-May, where the reward for successfully “mining” a Bitcoin block (which takes place approximately every 10 minutes) will fall from 12.5 BTC to 6.25 BTC. This will bring Bitcoin’s overall supply inflation rate down from about 3.7% to 1.8%. Historically, Bitcoin has shown a tendency to rally in the wake of previous “halvings,” though it’s difficult to draw any strong conclusions off a sample size of the two occasions.
Source: 99Bitcoins, GAIN Capital. Note that this chart uses a logarithmic scale.
Developers continue to work on improvements to Bitcoin’s protocol, with projects like the Lightning Network, for lower-value off-chain transactions, and Taproot, a privacy upgrade which is gaining momentum.
Regulatory policies will play a major role in Bitcoin’s performance in 2020
More than incremental technological improvements though, regulatory policies will play a major role in Bitcoin’s performance in 2020. For Bitcoin bulls, the proverbial “White Whale” is the approval of a Bitcoin ETF (exchange-traded fund) in the US that would make it easier for everyday retail traders to invest in the cryptocurrency. Despite numerous proposals over the last year, US regulators have failed to greenlight a fund yet. If such a fund is approved in 2020, it would be perhaps the biggest possible bullish catalyst for Bitcoin, opening the floodgates for retail and institutional capital to flow into Bitcoin.
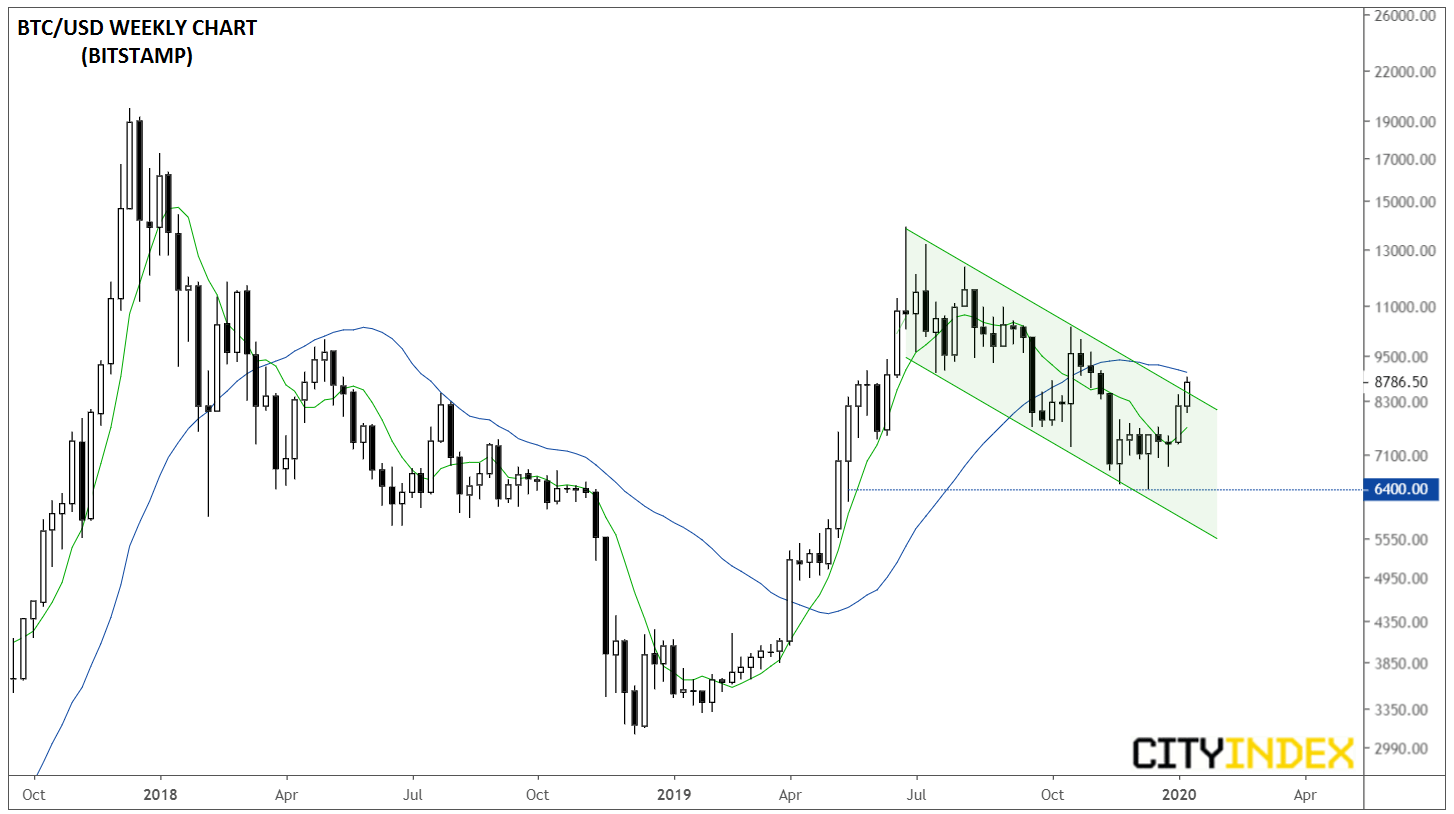
Technically speaking, Bitcoin is breaking out of its near-term downtrend off the June peak near $14k. The cryptocurrency recently broke above its 7-week (~50-day) moving average and bulls will now turn their eyes toward the 29-week (~200-day) moving average. Beyond that, bulls may turn their eyes toward the psychologically-significant $10k level, followed by the Q3 highs starting around $12k. On a longer-term basis, the key level of horizontal support to watch will be the Q4 lows near $6400.
Source: TradingView, GAIN Capital. Note that this chart uses a logarithmic scale.
This article is a complement to our full 2020 Market Outlook report - please download the full report for more insight into our views for major markets this year, including bold predictions from the research team!
To simplify, each of the last three years has had a distinct “theme” for the overall cryptoasset markets:
- 2017 was the peak mania/bubble period, especially in the 2nd half of the year.
- 2018 was the year the bubble popped, leading to deflating expectations and prices.
- 2019 was the year of recovery and “green shoots” for future use cases.
As we flip our calendars to 2020, the top question for traders and investors is whether the exciting technological groundwork laid in 2019 will pay dividends for investors, users, and developers.
State of the Crypto Market
Far from the heady, halcyon days of late 2017, the cryptoasset markets are far tamer and more grounded as of writing in December 2019. After peaking above $800B at the start of 2018, the overall market capitalization of all the tokens in circulation has fallen to roughly $200B.
Source: CoinMarketCap
The majority of the “value” lost has come from so-called “altcoins” which include many of the overhyped ICO projects built in Ethereum’s smart contract ecosystem. While Bitcoin has been more than cut in half from its December 2017 peak, it’s fallen less than many competitors, leading to an increase in Bitcoin “dominance” or the portion of overall market value attributable to the original cryptocurrency.
Source: CoinMarketCap
As the chart above shows, Bitcoin now represents about two-thirds of the overall cryptoasset market capitalization, with rivals such as Ethereum, Ripple (XRP), and Bitcoin Cash losing market share. Generally speaking, the above chart can serve as an indicator of so-called “alt seasons”: when Bitcoin’s dominance is trending higher, crypto traders prefer to hold Bitcoin itself, whereas a turn lower in Bitcoin could signal that altcoins are poised to outperform.
Bitcoin’s relative outperformance from 2018-19 is poised to extend further in 2020
Bitcoin is scheduled for a “halving” of its block reward in mid-May, where the reward for successfully “mining” a Bitcoin block (which takes place approximately every 10 minutes) will fall from 12.5 BTC to 6.25 BTC. This will bring Bitcoin’s overall supply inflation rate down from about 3.7% to 1.8%. Historically, Bitcoin has shown a tendency to rally in the wake of previous “halvings,” though it’s difficult to draw any strong conclusions off a sample size of the two occasions.
Source: 99Bitcoins, GAIN Capital. Note that this chart uses a logarithmic scale.
Developers continue to work on improvements to Bitcoin’s protocol, with projects like the Lightning Network, for lower-value off-chain transactions, and Taproot, a privacy upgrade which is gaining momentum.
Regulatory policies will play a major role in Bitcoin’s performance in 2020
More than incremental technological improvements though, regulatory policies will play a major role in Bitcoin’s performance in 2020. For Bitcoin bulls, the proverbial “White Whale” is the approval of a Bitcoin ETF (exchange-traded fund) in the US that would make it easier for everyday retail traders to invest in the cryptocurrency. Despite numerous proposals over the last year, US regulators have failed to greenlight a fund yet. If such a fund is approved in 2020, it would be perhaps the biggest possible bullish catalyst for Bitcoin, opening the floodgates for retail and institutional capital to flow into Bitcoin.
Technically speaking, Bitcoin is breaking out of its near-term downtrend off the June peak near $14k. The cryptocurrency recently broke above its 7-week (~50-day) moving average and bulls will now turn their eyes toward the 29-week (~200-day) moving average. Beyond that, bulls may turn their eyes toward the psychologically-significant $10k level, followed by the Q3 highs starting around $12k. On a longer-term basis, the key level of horizontal support to watch will be the Q4 lows near $6400.
Source: TradingView, GAIN Capital. Note that this chart uses a logarithmic scale.
Related tags:




The complete CFD trading experience
Award-winning platforms, competitive spreads, low commissions and dedicated support.
We live and breathe the markets and are dedicated to helping traders realise their ambitions as we continue to set the industry bar.
Economic calendar
Web Trader platform
Our sophisticated web-based platform is packed with features.
Related articles

Bitcoin Analysis: Is Uncertainty Returning to BTC?
Recent trading sessions have not been particularly supportive of a clear directional move in Bitcoin. This can be seen in the behavior of the price over the last four sessions, where fluctuations have remained close to 1.00% without establishing a consistent trend. As a result, a growing sense of neutrality is beginning to emerge around BTC.


Gold Dips Below Three-Month Uptrend, Bitcoin Pulls Back from Nine-Month High
Gold has dipped below its three-month uptrend, while Bitcoin has pulled back from a nine-month high as U.S. bond yields test levels last seen in 2004 and 2007. Risks build as Fed rate-hike expectations remain above 70%, while the Dollar Index holds near yearly highs.


Crypto Outlook: Altcoins Lead the Rally as Bitcoin Pauses
With only a few days left in September, the cryptocurrency market continues to show a constructive short-term outlook. The latest trading week has delivered meaningful gains across most major digital assets and, broadly speaking, the bullish bias remains the dominant force within the market.
StoneX Europe Ltd may make third party material available on this website which may contain information included but not limited to the conditions of financial markets. The material is for information purposes only and does not contain, and should not be construed as containing, investment advice and/or investment recommendation and/or an investment research and/or an offer of or solicitation for any transactions in financial instruments; any decision to enter into a specific transaction shall be made by the client following an assessment by him/her of their situation.
StoneX Europe Ltd makes no representation or warranty and assumes no liability as to the accuracy or completeness of the information provided, nor any loss arising from any investment based on a recommendation, forecast or other information supplied. You should always seek independent advice as to your suitability to speculate in any related markets and your ability to assume the associated risks, if you are at all unsure. We are not under any obligation to update any such material. Any opinion made may be personal to the author and may not reflect the opinion of StoneX Europe Ltd.