





Crude is Quietly up 1
Crude oil is sensitive to trade related headlines.
Share this:

As the markets patiently await the next headline regarding the US-China trade talks, WTI Crude Oil is quietly up 1% at 53.20 since the open, down from earlier levels at 53.63. Crude oil is sensitive to trade related headlines. The oil market is taking the view that better trade relations between the US and China equals a pickup in manufacturing, which in turn, equals more demand for crude oil. Talks overnight have picked up slightly with China saying it will agree to buy $10 million worth of soybeans.
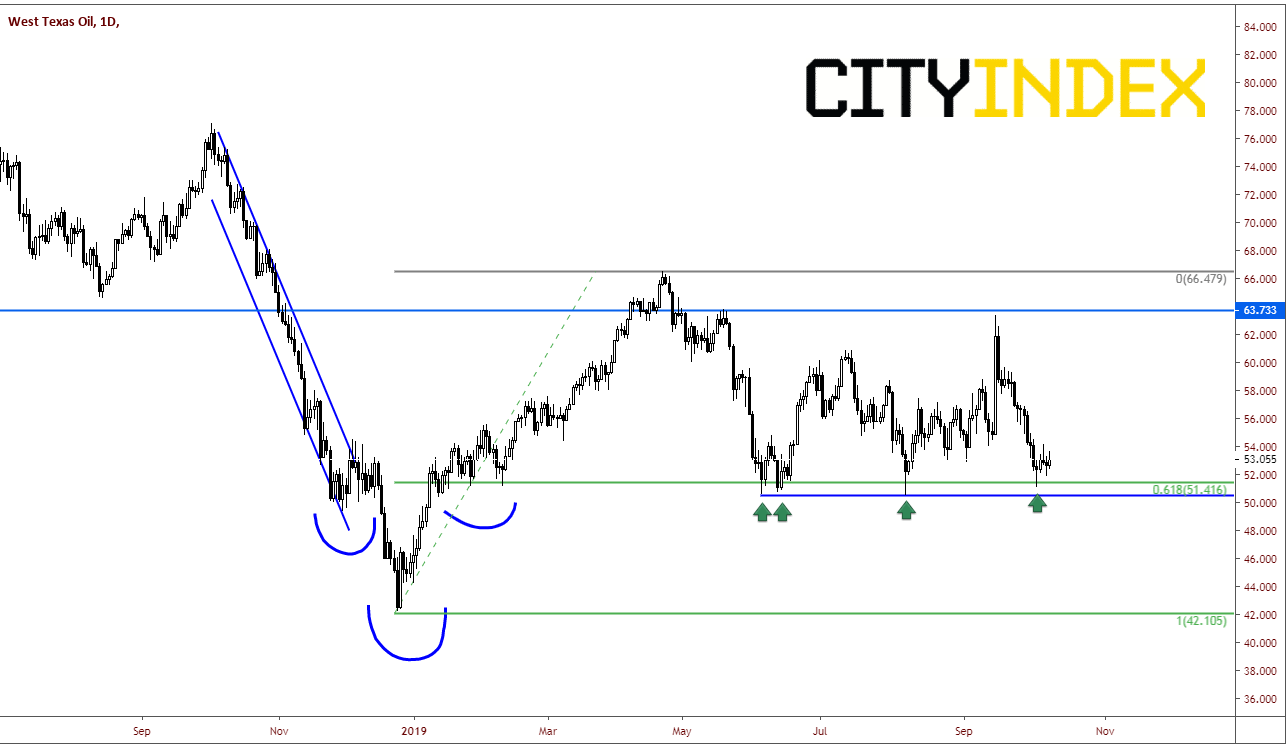
After retracing 61.8% of the move from the October 3rd, 2018 highs to the December 24th 2018 lows, WTI Crude has been in a large trading range, primarily between 53.25 and 63.75. However, since September 13th, price has been moving lower and last week tested the 61.8% retracement level from the highs on April 23rd to the lows on June 5th at 51.40, for the 4th time! Each time price tested this level it bounced.
Source: Tradingview, City Index
On a 240-minute chart, one can see clearer how price has been drifting lower since to September 13th highs. Price briefly broke out of the bottom of the channel and traded down to 51.06, putting in a daily hammer candlestick formation. This is considered to be a 1 candle reversal pattern. As we see so often, once we fail to break out of one side of a channel, the other side is often tested. That was the case here, as price moved to the top of the channel and put in an evening star formation, which is a 3-candle reversal formation candle. However yesterday, price broke back out of the top of the downward sloping trendline and is currently trading above it today.
Source: Tradingview, City Index
First resistance level is previous highs and horizontal resistance at 54.01. Above that there is horizontal resistance at 54.85. Third level of resistance is the 38.2% Fibonacci retracement level from the previously mentioned timeframe at 55.78. Support is back at the breakout of the channel near 52.80. Next support level is was down at 51.06, spike low on October 3rd.
As the markets patiently await the next headline regarding the US-China trade talks, WTI Crude Oil is quietly up 1% at 53.20 since the open, down from earlier levels at 53.63. Crude oil is sensitive to trade related headlines. The oil market is taking the view that better trade relations between the US and China equals a pickup in manufacturing, which in turn, equals more demand for crude oil. Talks overnight have picked up slightly with China saying it will agree to buy $10 million worth of soybeans.
After retracing 61.8% of the move from the October 3rd, 2018 highs to the December 24th 2018 lows, WTI Crude has been in a large trading range, primarily between 53.25 and 63.75. However, since September 13th, price has been moving lower and last week tested the 61.8% retracement level from the highs on April 23rd to the lows on June 5th at 51.40, for the 4th time! Each time price tested this level it bounced.
Source: Tradingview, FOREX.com
On a 240-minute chart, one can see clearer how price has been drifting lower since to September 13th highs. Price briefly broke out of the bottom of the channel and traded down to 51.06, putting in a daily hammer candlestick formation. This is considered to be a 1 candle reversal pattern. As we see so often, once we fail to break out of one side of a channel, the other side is often tested. That was the case here, as price moved to the top of the channel and put in an evening star formation, which is a 3-candle reversal formation candle. However yesterday, price broke back out of the top of the downward sloping trendline and is currently trading above it today.
Source: Tradingview, FOREX.com
First resistance level is previous highs and horizontal resistance at 54.01. Above that there is horizontal resistance at 54.85. Third level of resistance is the 38.2% Fibonacci retracement level from the previously mentioned timeframe at 55.78. Support is back at the breakout of the channel near 52.80. Next support level is was down at 51.06, spike low on October 3rd.
Related tags:




The complete CFD trading experience
Award-winning platforms, competitive spreads, low commissions and dedicated support.
We live and breathe the markets and are dedicated to helping traders realise their ambitions as we continue to set the industry bar.
Economic calendar
Web Trader platform
Our sophisticated web-based platform is packed with features.
Related articles
StoneX Europe Ltd may make third party material available on this website which may contain information included but not limited to the conditions of financial markets. The material is for information purposes only and does not contain, and should not be construed as containing, investment advice and/or investment recommendation and/or an investment research and/or an offer of or solicitation for any transactions in financial instruments; any decision to enter into a specific transaction shall be made by the client following an assessment by him/her of their situation.
StoneX Europe Ltd makes no representation or warranty and assumes no liability as to the accuracy or completeness of the information provided, nor any loss arising from any investment based on a recommendation, forecast or other information supplied. You should always seek independent advice as to your suitability to speculate in any related markets and your ability to assume the associated risks, if you are at all unsure. We are not under any obligation to update any such material. Any opinion made may be personal to the author and may not reflect the opinion of StoneX Europe Ltd.