



Does oil rebound finish
Oil prices were pressured by downbeat oil demand predictions by various oil-industry participants. U.S. WTI crude oil futures (November) shed 3.2% to $39.29 a barrel on Monday, the lowest level in two weeks.
Share this:

Russia's oil output was slightly up to 9.93M barrels per day for the first 28 days of September, compared with 9.87M barrels per day in August, according to Bloomberg. In addition, the resumption of Libya's oil production also increased the global oil supply. Traders are worried about the risk of the rising supply, but the oil demand is still struggling.
On the economic front, the American Petroleum Institute (API) reported that U.S. crude-oil inventories fell 831,000 barrels in the week ending September 25. Later today, the U.S. Energy Information Administration (EIA) will release official crude oil inventories data for the same period.
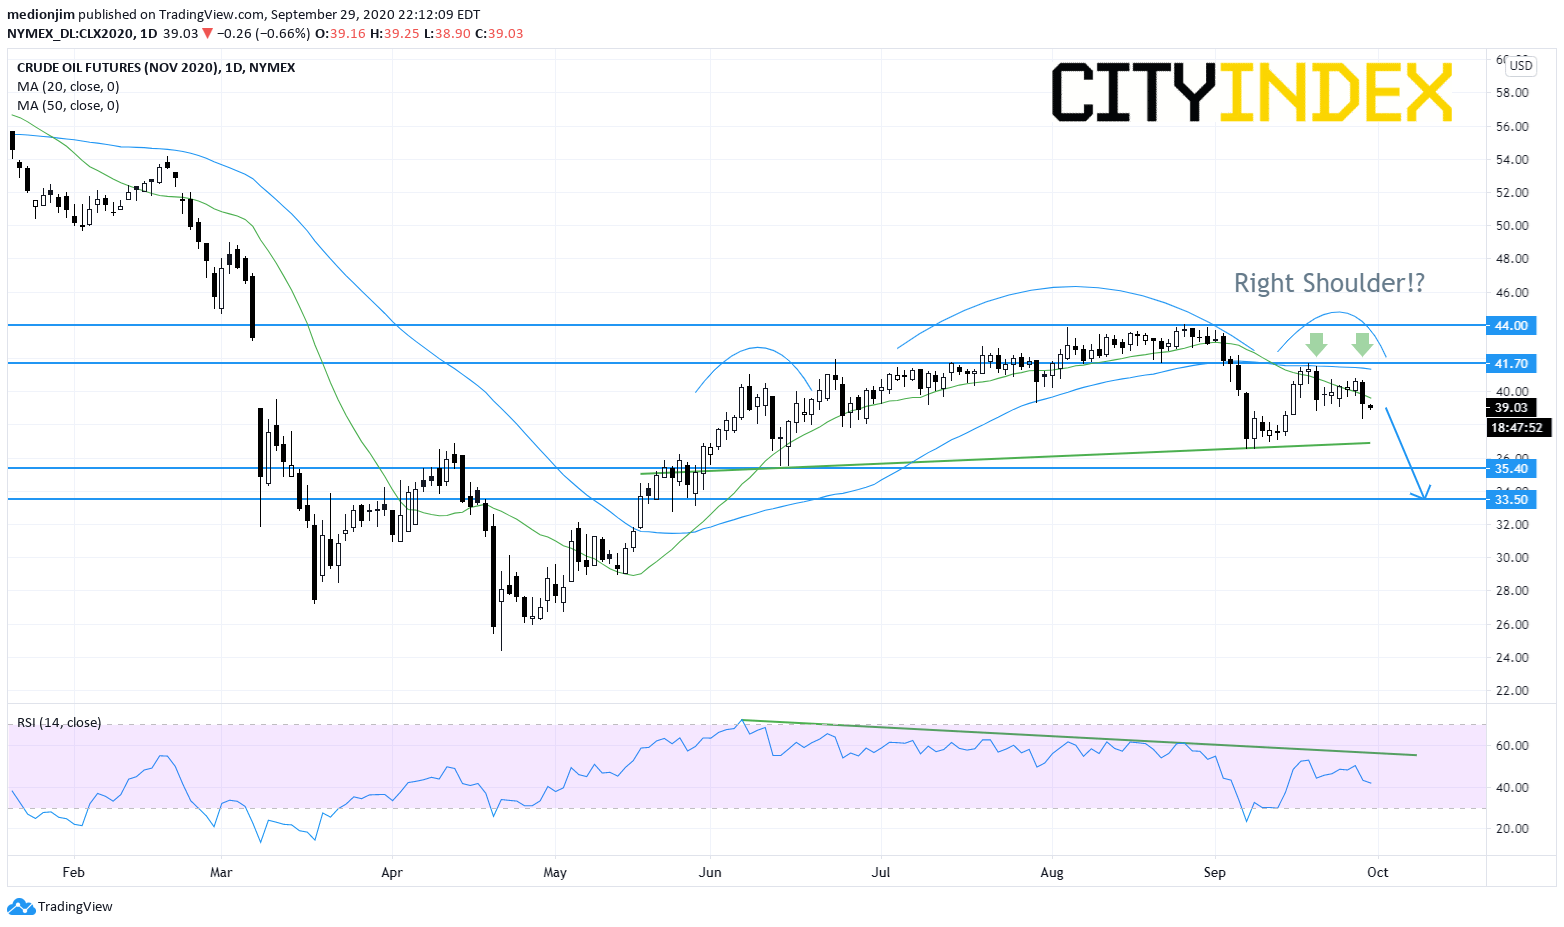
From a technical point of view, the crude oil futures posted another bearish candle and washed out the recent rebound in the last few days on a daily chart. It shows that the bearish side is still determining the trend.
Currently, the prices returned the level below the 20-day moving average. In addition, the prices may form a potential right shoulder. A break below the horizontal level at $35.40 would confirm the Head and Shoulder pattern.
Besides, the relative strength index is also capped by a declining trend line.
The bearish readers could set the resistance level at $41.70, while the support levels would be located at $35.40 and $33.50.
Source: Gain Capital, TradingView
On the economic front, the American Petroleum Institute (API) reported that U.S. crude-oil inventories fell 831,000 barrels in the week ending September 25. Later today, the U.S. Energy Information Administration (EIA) will release official crude oil inventories data for the same period.
From a technical point of view, the crude oil futures posted another bearish candle and washed out the recent rebound in the last few days on a daily chart. It shows that the bearish side is still determining the trend.
Currently, the prices returned the level below the 20-day moving average. In addition, the prices may form a potential right shoulder. A break below the horizontal level at $35.40 would confirm the Head and Shoulder pattern.
Besides, the relative strength index is also capped by a declining trend line.
The bearish readers could set the resistance level at $41.70, while the support levels would be located at $35.40 and $33.50.
Source: Gain Capital, TradingView
Russia's oil output was slightly up to 9.93M barrels per day for the first 28 days of September, compared with 9.87M barrels per day in August, according to Bloomberg. In addition, the resumption of Libya's oil production also increased the global oil supply. Traders are worried about the risk of the rising supply, but the oil demand is still struggling.
On the economic front, the American Petroleum Institute (API) reported that U.S. crude-oil inventories fell 831,000 barrels in the week ending September 25. Later today, the U.S. Energy Information Administration (EIA) will release official crude oil inventories data for the same period.
From a technical point of view, the crude oil futures posted another bearish candle and washed out the recent rebound in the last few days on a daily chart. It shows that the bearish side is still determining the trend.
Currently, the prices returned the level below the 20-day moving average. In addition, the prices may form a potential right shoulder. A break below the horizontal level at $35.40 would confirm the Head and Shoulder pattern.
Besides, the relative strength index is also capped by a declining trend line.
The bearish readers could set the resistance level at $41.70, while the support levels would be located at $35.40 and $33.50.

Source: Gain Capital, TradingView
On the economic front, the American Petroleum Institute (API) reported that U.S. crude-oil inventories fell 831,000 barrels in the week ending September 25. Later today, the U.S. Energy Information Administration (EIA) will release official crude oil inventories data for the same period.
From a technical point of view, the crude oil futures posted another bearish candle and washed out the recent rebound in the last few days on a daily chart. It shows that the bearish side is still determining the trend.
Currently, the prices returned the level below the 20-day moving average. In addition, the prices may form a potential right shoulder. A break below the horizontal level at $35.40 would confirm the Head and Shoulder pattern.
Besides, the relative strength index is also capped by a declining trend line.
The bearish readers could set the resistance level at $41.70, while the support levels would be located at $35.40 and $33.50.
Source: Gain Capital, TradingView
Related tags:
Latest market news




The complete CFD trading experience
Award-winning platforms, competitive spreads, low commissions and dedicated support.
We live and breathe the markets and are dedicated to helping traders realise their ambitions as we continue to set the industry bar.
Economic calendar
Web Trader platform
Our sophisticated web-based platform is packed with features.
Related articles
StoneX Europe Ltd may make third party material available on this website which may contain information included but not limited to the conditions of financial markets. The material is for information purposes only and does not contain, and should not be construed as containing, investment advice and/or investment recommendation and/or an investment research and/or an offer of or solicitation for any transactions in financial instruments; any decision to enter into a specific transaction shall be made by the client following an assessment by him/her of their situation.
StoneX Europe Ltd makes no representation or warranty and assumes no liability as to the accuracy or completeness of the information provided, nor any loss arising from any investment based on a recommendation, forecast or other information supplied. You should always seek independent advice as to your suitability to speculate in any related markets and your ability to assume the associated risks, if you are at all unsure. We are not under any obligation to update any such material. Any opinion made may be personal to the author and may not reflect the opinion of StoneX Europe Ltd.