





Technical Tuesday: DJIA, USD/CHF and Copper
Technical analysis on some of the most interesting markets right now
Share this:

Welcome to Technical Tuesday, a weekly report where we highlight some of the most interesting markets that will hopefully appease technical analysts and traders alike.
In this week’s edition, we are getting technical on the Dow, USD/CHF and copper. So, there’s something for everyone. Without further ado…
1. Dow Jones
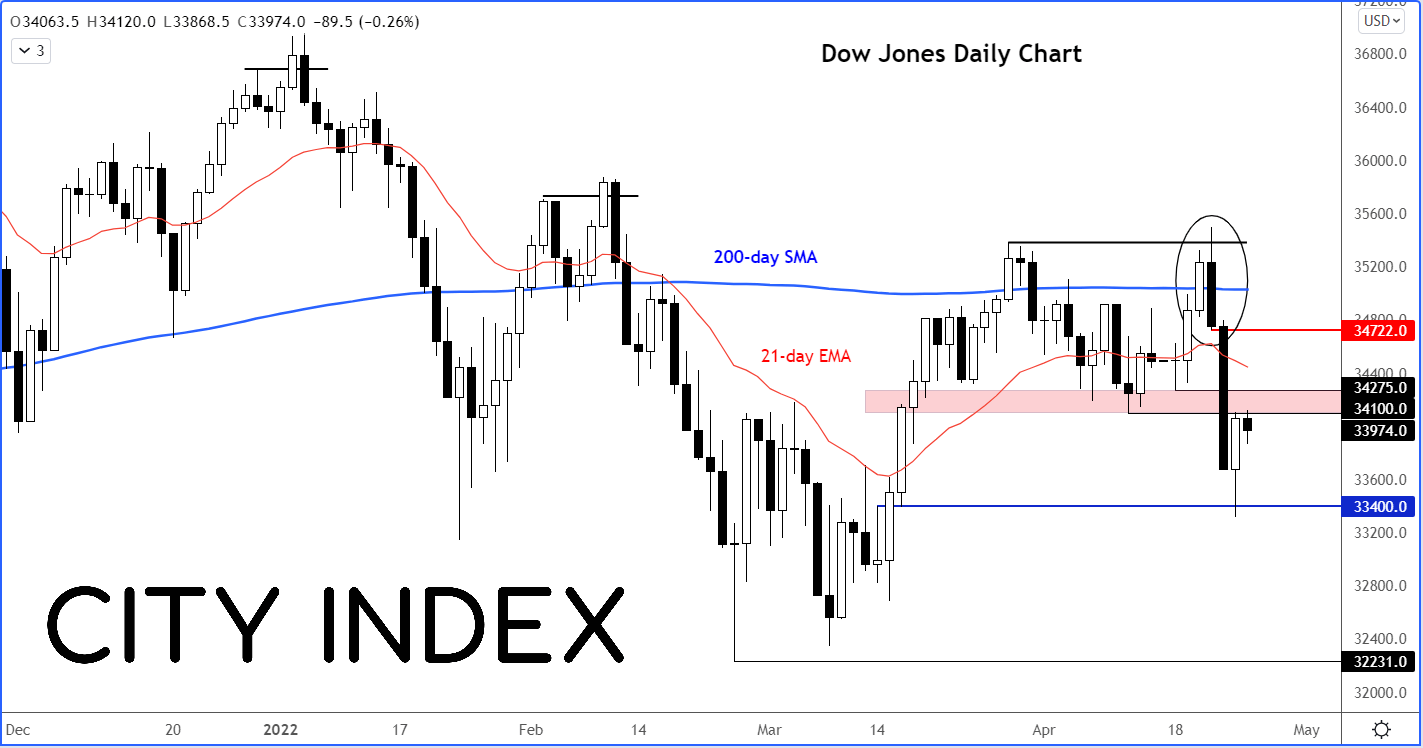
Like many other global indices, the Dow reversed sharply last Thursday as concerns over weakening Chinese demand amid the covid-linked lockdowns there added to fears over global stagflation and monetary tightening. The index fell after it failed to hold above its 200-day moving average, creating a large bearish engulfing candle in the process, which correctly signalled that more losses would be on the way as we found out on Friday when it declined more than 3 percent.
As a result of that sell-off, the Dow has now formed a lower low as it took out the prior April low of 34100 and prior support around 34275. The area between these levels now represents the first line of defence for the bears, followed by the base of the breakdown around 34720ish.
On the downside, the first level of support around 33400 has been tested on Monday when the market bounced strongly from there. But the damage might have already been done and Monday’s bounce could get faded into as the index now tests the abovementioned former support levels, which could turn into resistance.
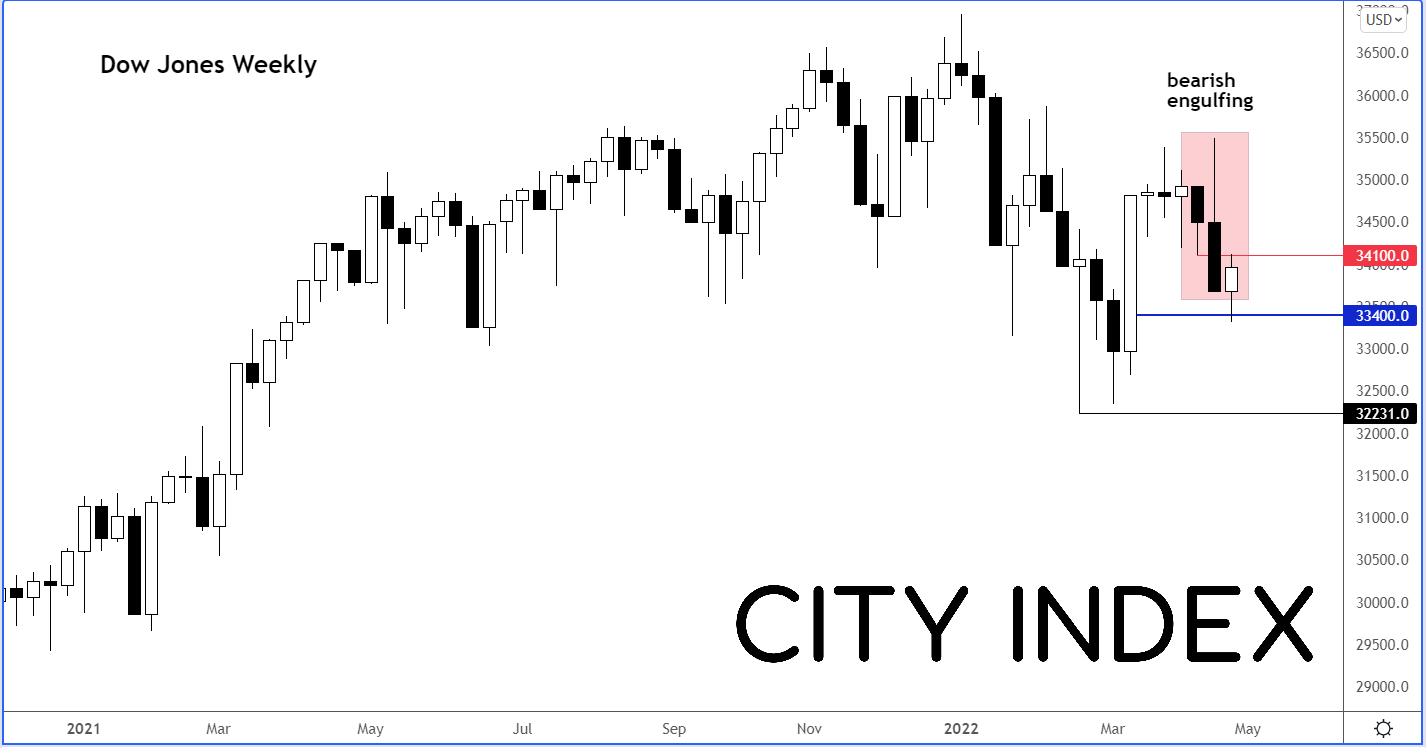
Indeed, the weekly chart isn’t exactly looking very bullish right now:
The big bearish engulfing candle from last week might encourage the bears to step in on this rebound and drive the index lower.
2. USD/CHF
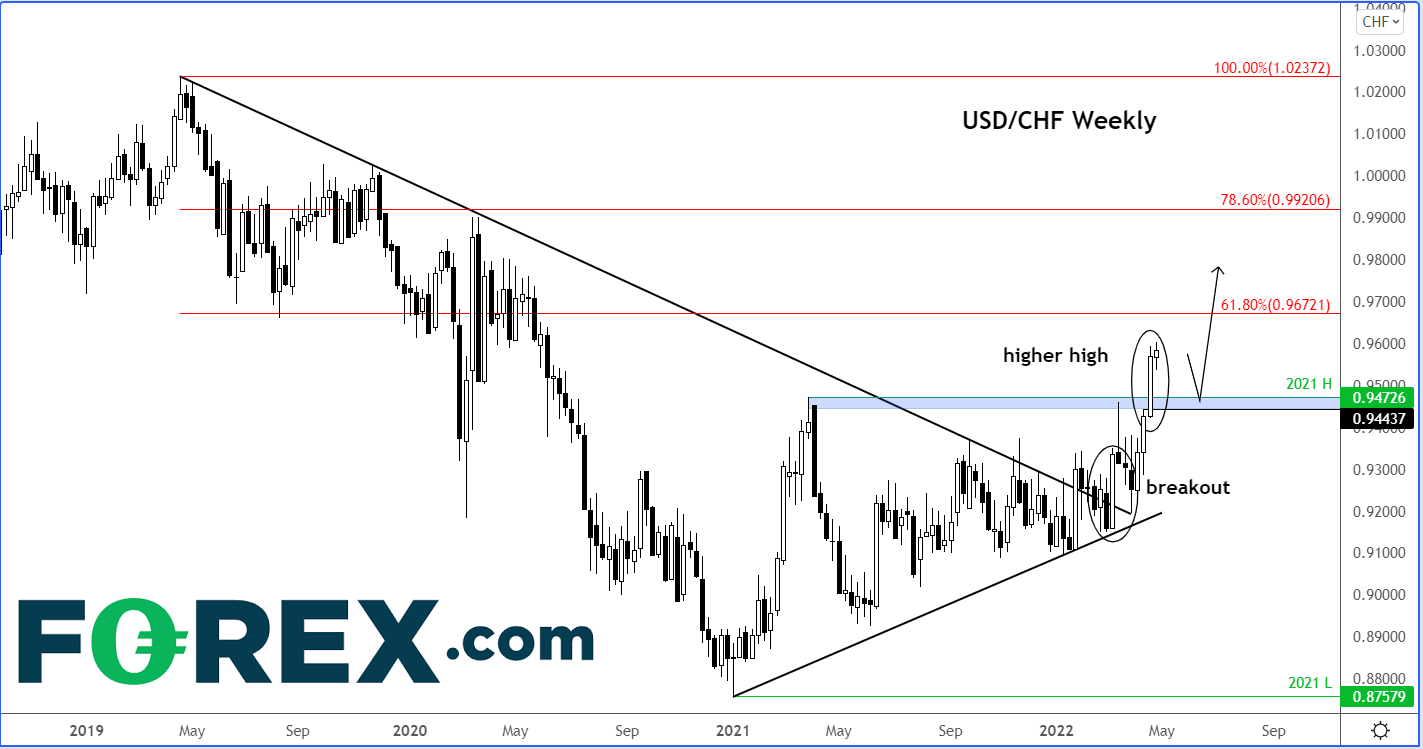
The USD/CHF last week made a higher high as it took out the 2021 peak at 0.9472. Previously, it had broken a bearish trend line several weeks ago. The USD/CHF has been driven higher by a strong rally in US dollar thanks to the Fed turning increasingly hawkish. It is possible that many traders might have missed out on this rally. They will be hoping that we might see some further weakness for stock markets in order to boost the appeal of the safe-haven Swiss franc to the point that it causes the USD/CHF to dip back down to the former breakout area circa 0.9440-0.9470ish. This area is where we may then see dip buyers step back in to drive the USD/CHF further higher.
Alternatively, if the USD/CHF does not pullback as we have outlined above, bullish traders could zoom in to a smaller time frame and look for alternative trade ideas – for example breakout from a short-term consolidation pattern.
3. Copper
Concerns over Chinese demand saw the price of copper collapse on Monday as it took out the bullish trend line, which must have triggered follow-up technical selling as bulls’ stops were tripped. The metal has now paused its selling with the bulls attempting to defend their ground around the 200-day moving average, which was being tested at the time of writing. But with key support in the $4.500 region breaking, the bears have now got some confirmation to suggest that we have possibly seen the high, at least for a while. From here, an eventual drop to $4.00 cannot be ruled. There will be some interim support levels to watch for a potential bounce, for example the 200-day average at $4.430 or the head of the doji candle from January 31 further lower around $4.348. But so long as that $4.500 area holds as resistance now, the path of least resistance would be to the downside.
How to trade with City Index
You can trade with City Index by following these four easy steps:
- Open an account, or log in if you’re already a customer
• Open an account in the UK
• Open an account in Australia
• Open an account in Singapore
- Search for the instrument you want to trade in our award-winning platform
- Choose your position and size, and your stop and limit levels
- Place the trade
Welcome to Technical Tuesday, a weekly report where we highlight some of the most interesting markets that will hopefully appease technical analysts and traders alike.
In this week’s edition, we are getting technical on the Dow, USD/CHF and copper. So, there’s something for everyone. Without further ado…
1. Dow Jones
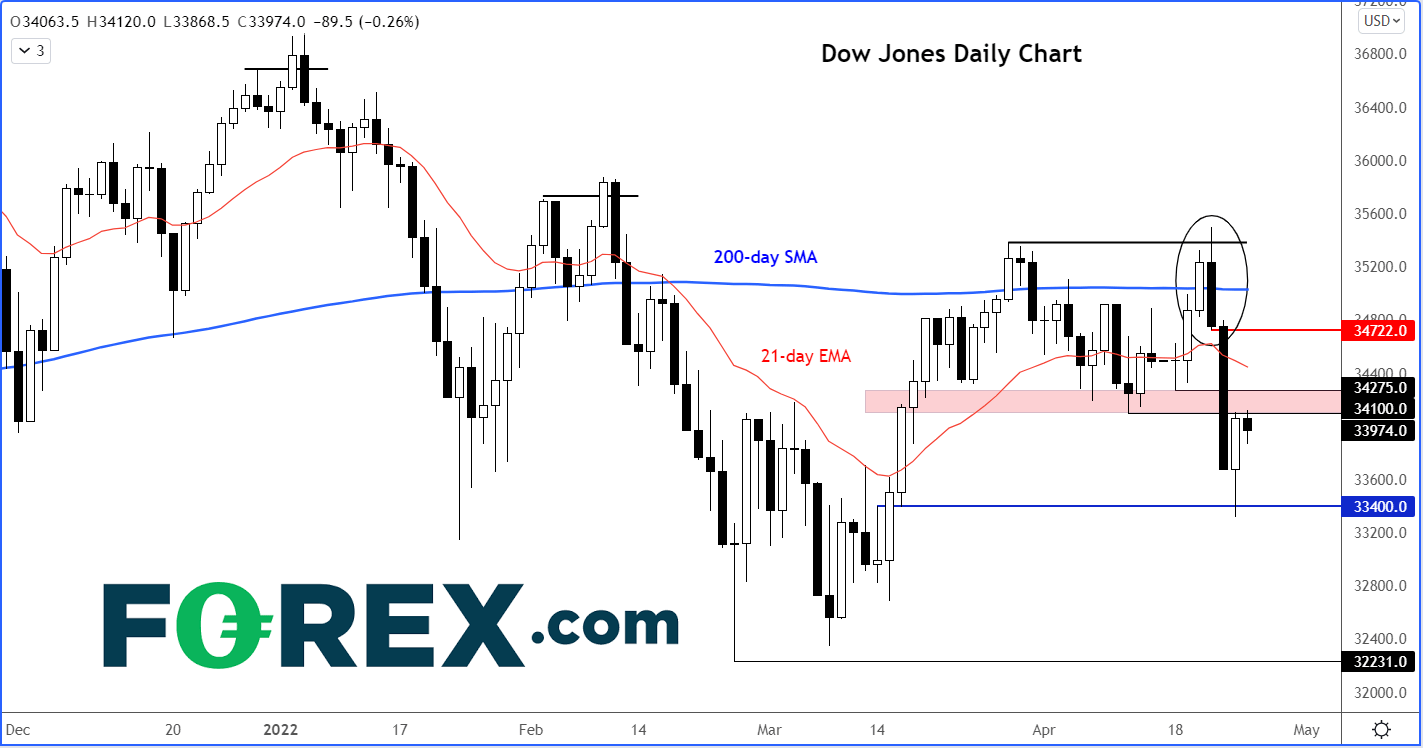
Like many other global indices, the Dow reversed sharply last Thursday as concerns over weakening Chinese demand amid the covid-linked lockdowns there added to fears over global stagflation and monetary tightening. The index fell after it failed to hold above its 200-day moving average, creating a large bearish engulfing candle in the process, which correctly signalled that more losses would be on the way as we found out on Friday when it declined more than 3 percent.
As a result of that sell-off, the Dow has now formed a lower low as it took out the prior April low of 34100 and prior support around 34275. The area between these levels now represents the first line of defence for the bears, followed by the base of the breakdown around 34720ish.
On the downside, the first level of support around 33400 has been tested on Monday when the market bounced strongly from there. But the damage might have already been done and Monday’s bounce could get faded into as the index now tests the abovementioned former support levels, which could turn into resistance.
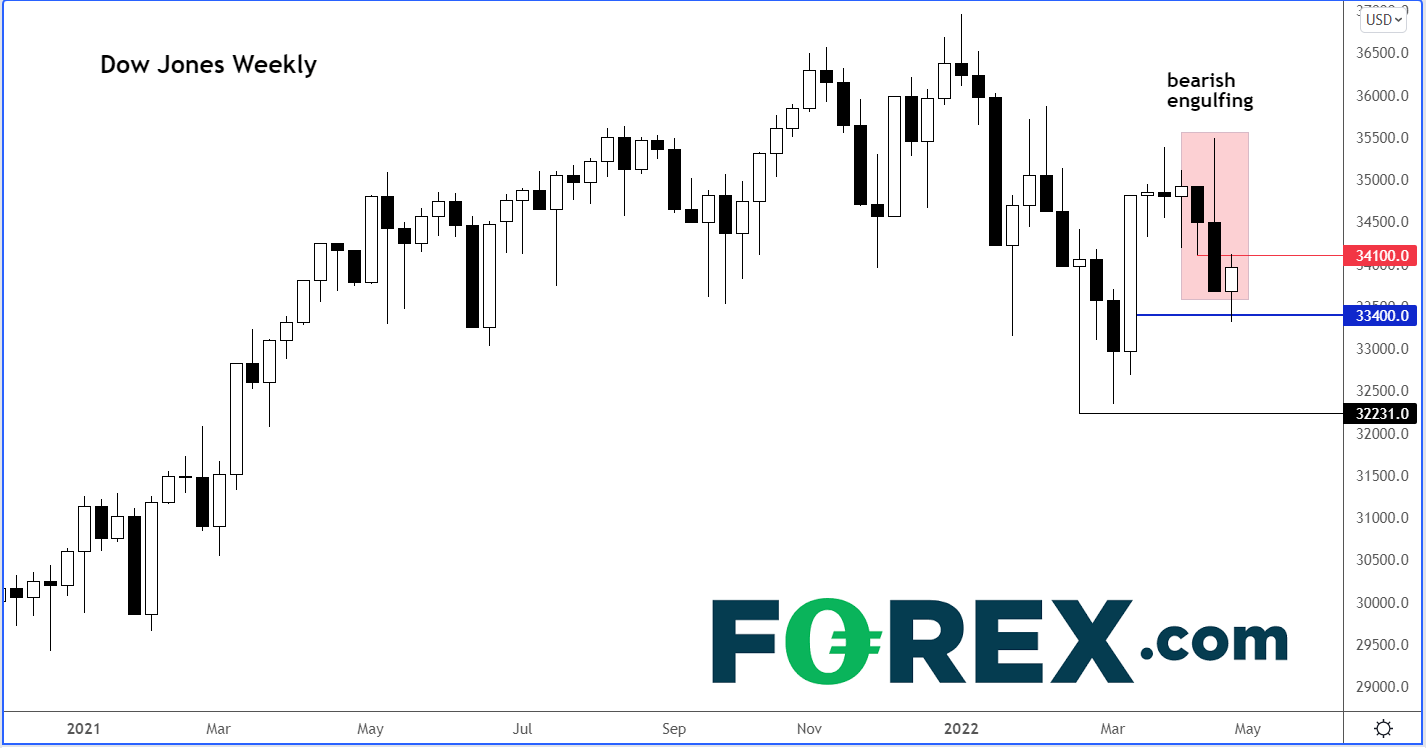
Indeed, the weekly chart isn’t exactly looking very bullish right now:
The big bearish engulfing candle from last week might encourage the bears to step in on this rebound and drive the index lower.
2. USD/CHF
The USD/CHF last week made a higher high as it took out the 2021 peak at 0.9472. Previously, it had broken a bearish trend line several weeks ago. The USD/CHF has been driven higher by a strong rally in US dollar thanks to the Fed turning increasingly hawkish. It is possible that many traders might have missed out on this rally. They will be hoping that we might see some further weakness for stock markets in order to boost the appeal of the safe-haven Swiss franc to the point that it causes the USD/CHF to dip back down to the former breakout area circa 0.9440-0.9470ish. This area is where we may then see dip buyers step back in to drive the USD/CHF further higher.
Alternatively, if the USD/CHF does not pullback as we have outlined above, bullish traders could zoom in to a smaller time frame and look for alternative trade ideas – for example breakout from a short-term consolidation pattern.
3. Copper
Concerns over Chinese demand saw the price of copper collapse on Monday as it took out the bullish trend line, which must have triggered follow-up technical selling as bulls’ stops were tripped. The metal has now paused its selling with the bulls attempting to defend their ground around the 200-day moving average, which was being tested at the time of writing. But with key support in the $4.500 region breaking, the bears have now got some confirmation to suggest that we have possibly seen the high, at least for a while. From here, an eventual drop to $4.00 cannot be ruled. There will be some interim support levels to watch for a potential bounce, for example the 200-day average at $4.430 or the head of the doji candle from January 31 further lower around $4.348. But so long as that $4.500 area holds as resistance now, the path of least resistance would be to the downside.
Related tags:
Latest market news



The complete CFD trading experience
Award-winning platforms, competitive spreads, low commissions and dedicated support.
We live and breathe the markets and are dedicated to helping traders realise their ambitions as we continue to set the industry bar.
Economic calendar
Web Trader platform
Our sophisticated web-based platform is packed with features.
Related articles
S&P 500 forecast: Stocks extend drop as correction risks grow
US and global equity markets have extended Wednesday’s sell-off, with Wall Street opening lower after a weak handover from Asia and Europe. The deterioration in risk appetite has been spreading across global markets. The dollar was firmer, Treasury yields were holding onto yesterday’s gains, while gold, silver and bitcoin were all under pressure alongside equities and major currencies.
Wall Street Forecast: DJIA falls as treasury yields hit new highs and ahead of the Trump-Xi summit
U.S. stocks are falling, further extending losses from the previous session, as oil prices move higher alongside Treasury yields and caution reigns ahead of the summit between President Trump and Xi Jinping.

Gold forecast: XAU/USD could take a larger dive after the big rise in yields
Gold prices have been falling in the last few days after last week’s post-FOMC pop faded amid rising interest rate expectations, higher oil prices and a strengthening US dollar. As before, I wasn’t convinced gold would thrive in the current macro backdrop.
StoneX Europe Ltd may make third party material available on this website which may contain information included but not limited to the conditions of financial markets. The material is for information purposes only and does not contain, and should not be construed as containing, investment advice and/or investment recommendation and/or an investment research and/or an offer of or solicitation for any transactions in financial instruments; any decision to enter into a specific transaction shall be made by the client following an assessment by him/her of their situation.
StoneX Europe Ltd makes no representation or warranty and assumes no liability as to the accuracy or completeness of the information provided, nor any loss arising from any investment based on a recommendation, forecast or other information supplied. You should always seek independent advice as to your suitability to speculate in any related markets and your ability to assume the associated risks, if you are at all unsure. We are not under any obligation to update any such material. Any opinion made may be personal to the author and may not reflect the opinion of StoneX Europe Ltd.