




Two trades to watch Gold FTSE
Gold declines on US Dollar strength post FOMC minutes, but COVID concerns cap losses. FTSE set for a weaker open as commodity stocks prepare to tank on USD strength & covid woes.
Share this:

Gold falls post FOMC minutes, covid fears cap losses
Gold is trading lower after buying picked up in the US Dollar following the release of the FOMC minutes.
The minutes showed that the US central bank could start tapering bond purchases later this year. There were also some policy makers who preferred next year as a starting date but the market decided not to focus on that.
Evidence that the market is now convinced that the Fed is comfortable with tapering support was seen in follow through buying of the US Dollar in Asia overnight & heading into the European open.
Still persistent COVID concerns appear to have prevented investors from placing aggressive sell bets in the precious metal.
US jobless claims are in focus late today.
Where next for Gold?
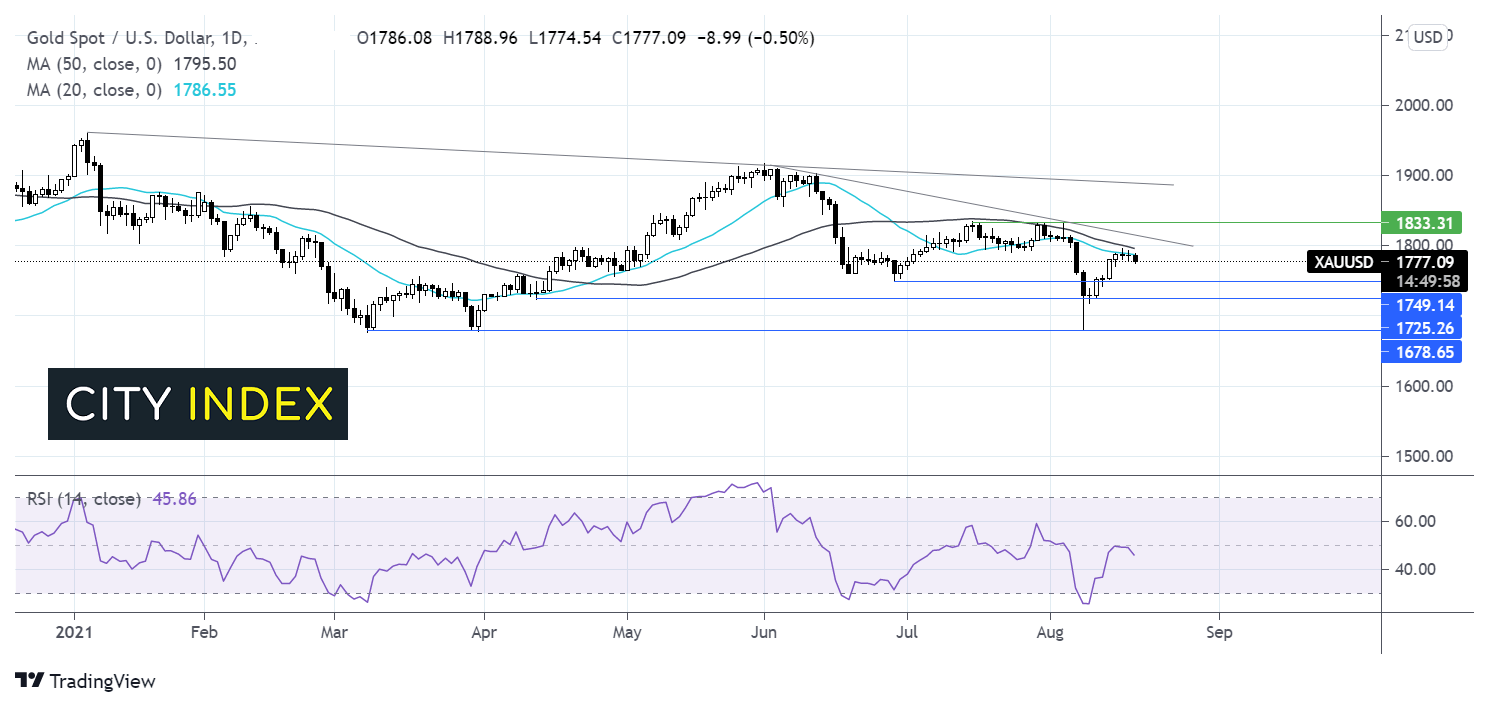
Gold rebounded off the 4-month low of $1679 on August 9. However, the recovery ran into resistance at the 50 dam which capped any move higher.
The price trades below its 50 & 100 sma and below its descending trendline dating back to early June in an establish bullish trend.
The 50 sma also crossed below the 100 sma in a bearish signal. Furthermore, the RSI has reversed direction and is in bearish territory pointing southwards suggesting there could be more downside to come.
Support can be seen at 1750 the June low, ahead of 1730 the April low before bears could look to retest 1679 the August low.
On the upside any recovery needs to close above the 20 sma at 1788 in order to test the 50 sma at 1795 and the ascending trendline at 1813.
FTSE tumbles as miners, oil major sink lower
The FTSE is set to start the session firmly in the red following the more hawkish FOMC minutes and on rising covid fears
The Fed minutes sent the US Dollar surging higher, which has dragged commodity prices sharply lower. The heavyweight mining stocks on the FTSE are in for a beating today.
Oil prices are also sharply lower, not only owing to the stronger US Dollar but also on climbing virus fears. Rising US inventories have fueled fears of weaker demand amid a spike of covid cases globally.
Where next for the FTSE?
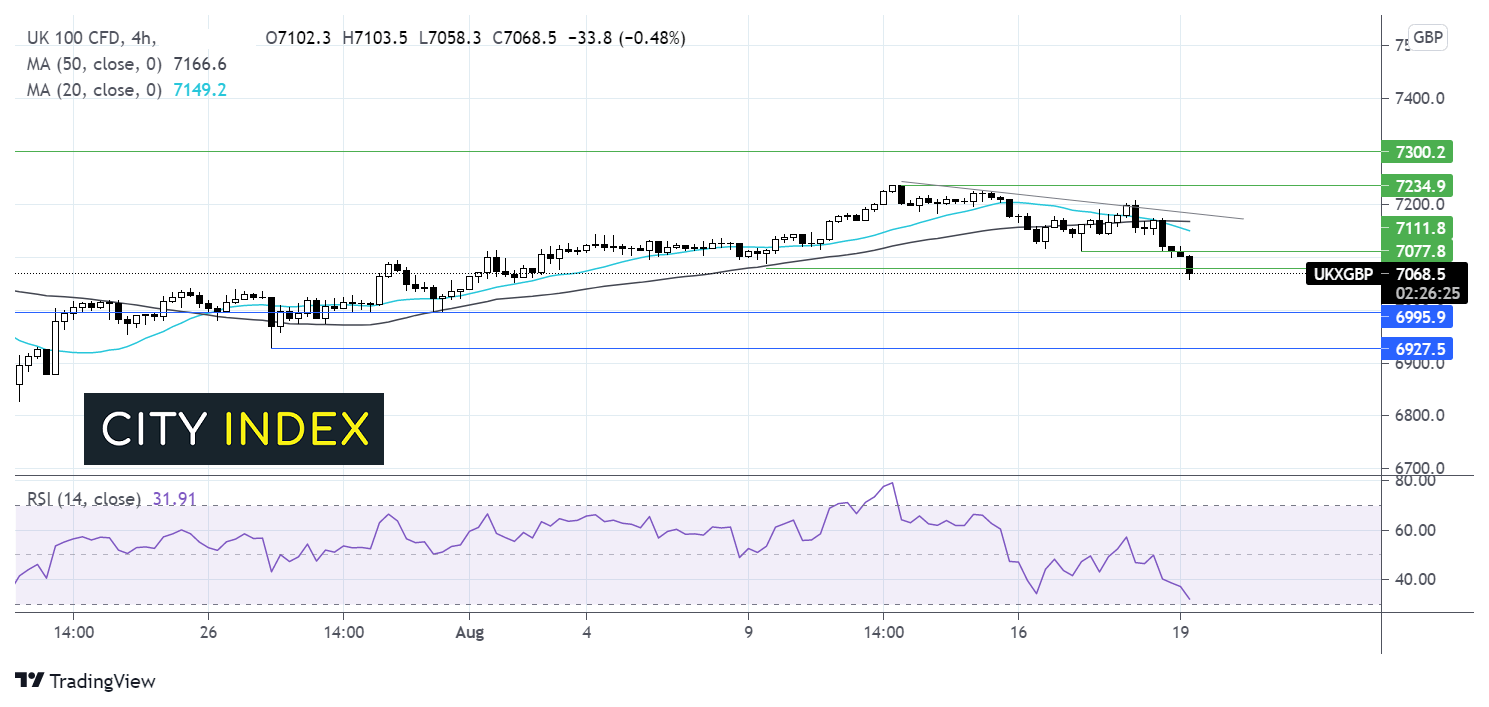
The FTSE’s rebound across the first half of the week stalled and is reversing. The price trades firmly below its 10 day descending trendline and has fallen below its 50 & 20 sma on the 4 hour chart. The 20 sma has also fallen below the 50 sma in a bearish signal.
The RSI is indicative of further losses whilst it remains out of oversold territory.
The price has fallen below horizontal support at 7090 the low August 9 and is heading towards 7000 key psychological level and 6995 the swing low July 30 and 6930 the low July 27.
On the flipside, resistance can be seen at 7080 the August 9 low and 7111 the August 17 low ahead of 7150 the 20 sma.

How to trade with FOREX.com
Follow these easy steps to start trading with FOREX.com today:
- Open a Forex.com account, or log-in if you’re already a customer.
- Search for the market you want to trade in our award-winning platform.
- Choose your position and size, and your stop and limit levels.
- Place the trade.
Gold falls post FOMC minutes, covid fears cap losses
Gold is trading lower after buying picked up in the US Dollar following the release of the FOMC minutes.
The minutes showed that the US central bank could start tapering bond purchases later this year. There were also some policy makers who preferred next year as a starting date but the market decided not to focus on that.
Evidence that the market is now convinced that the Fed is comfortable with tapering support was seen in follow through buying of the US Dollar in Asia overnight & heading into the European open.
Still persistent COVID concerns appear to have prevented investors from placing aggressive sell bets in the precious metal.
US jobless claims are in focus late today.
Where next for Gold?
Gold rebounded off the 4-month low of $1679 on August 9. However, the recovery ran into resistance at the 50 dam which capped any move higher.
The price trades below its 50 & 100 sma and below its descending trendline dating back to early June in an establish bullish trend.
The 50 sma also crossed below the 100 sma in a bearish signal. Furthermore, the RSI has reversed direction and is in bearish territory pointing southwards suggesting there could be more downside to come.
Support can be seen at 1750 the June low, ahead of 1730 the April low before bears could look to retest 1679 the August low.
On the upside any recovery needs to close above the 20 sma at 1788 in order to test the 50 sma at 1795 and the ascending trendline at 1813.
FTSE tumbles as miners, oil major sink lower
The FTSE is set to start the session firmly in the red following the more hawkish FOMC minutes and on rising covid fears
The Fed minutes sent the US Dollar surging higher, which has dragged commodity prices sharply lower. The heavyweight mining stocks on the FTSE are in for a beating today.
Oil prices are also sharply lower, not only owing to the stronger US Dollar but also on climbing virus fears. Rising US inventories have fueled fears of weaker demand amid a spike of covid cases globally.
Where next for the FTSE?
The FTSE’s rebound across the first half of the week stalled and is reversing. The price trades firmly below its 10 day descending trendline and has fallen below its 50 & 20 sma on the 4 hour chart. The 20 sma has also fallen below the 50 sma in a bearish signal.
The RSI is indicative of further losses whilst it remains out of oversold territory.
The price has fallen below horizontal support at 7090 the low August 9 and is heading towards 7000 key psychological level and 6995 the swing low July 30 and 6930 the low July 27.
On the flipside, resistance can be seen at 7080 the August 9 low and 7111 the August 17 low ahead of 7150 the 20 sma.
How to trade with City Index
Follow these easy steps to start trading with City Index today:
- Open a City Index account, or log-in if you’re already a customer.
- Search for the market you want to trade in our award-winning platform.
- Choose your position and size, and your stop and limit levels
- Place the trade.
Latest market news




The complete CFD trading experience
Award-winning platforms, competitive spreads, low commissions and dedicated support.
We live and breathe the markets and are dedicated to helping traders realise their ambitions as we continue to set the industry bar.
Economic calendar
Web Trader platform
Our sophisticated web-based platform is packed with features.
Related articles
Gold Q4 2026 outlook: Resilience in the face of rallying dollar and yields
As we headed towards the latter stages of Q3 and into Q4, the Fed had just hiked rates in a hawkish FOMC meeting, while the likes of the ECB and BoJ had also tightened their respective policies. Oil prices remained elevated amid the prolonged US-Iran conflict. Meanwhile, bond yields were breaking out, and the dollar was higher across the board. Yet, remarkably, gold was still holding in the positive territory for the third quarter, even if it had weakened somewhat in September.

Gold forecast: XAU/USD could take a larger dive after the big rise in yields
Gold prices have been falling in the last few days after last week’s post-FOMC pop faded amid rising interest rate expectations, higher oil prices and a strengthening US dollar. As before, I wasn’t convinced gold would thrive in the current macro backdrop.

Gold, silver slammed as hawkish Fed repricing reignites dollar upside
Gold and silver had held up surprisingly well against surging US yields. Wednesday’s DXY breakout may have changed that equation.

StoneX Europe Ltd may make third party material available on this website which may contain information included but not limited to the conditions of financial markets. The material is for information purposes only and does not contain, and should not be construed as containing, investment advice and/or investment recommendation and/or an investment research and/or an offer of or solicitation for any transactions in financial instruments; any decision to enter into a specific transaction shall be made by the client following an assessment by him/her of their situation.
StoneX Europe Ltd makes no representation or warranty and assumes no liability as to the accuracy or completeness of the information provided, nor any loss arising from any investment based on a recommendation, forecast or other information supplied. You should always seek independent advice as to your suitability to speculate in any related markets and your ability to assume the associated risks, if you are at all unsure. We are not under any obligation to update any such material. Any opinion made may be personal to the author and may not reflect the opinion of StoneX Europe Ltd.