



Weekly Technical Cryptocurrency Outlook: Selling Pressure Remains Relentless
As the second week of November comes to a close, the cryptocurrency market continues to show significant weakness across most major assets. The bearish bias appears far from over, and the market has entered a stage where confidence struggles to recover consistently, suggesting that selling pressure may continue to dominate as the year-end approaches.
Share this:

As the second week of November comes to a close, the cryptocurrency market continues to show significant weakness across most major assets. The bearish bias appears far from over, and the market has entered a stage where confidence struggles to recover consistently, suggesting that selling pressure may continue to dominate as the year-end approaches. For now, all major cryptocurrencies have ended the week in negative territory, underscoring the lack of risk appetite within the sector.


Performance of Major Cryptocurrencies
Source: Data - StoneX, Tradingview
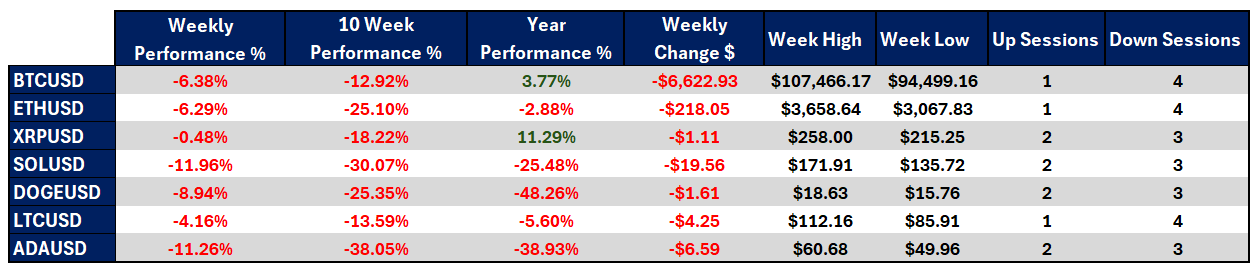
- Solana (SOL) remains the worst-performing cryptocurrency for the second consecutive week, with a -11.96% decline, solidifying its position as the weakest among major assets. In contrast, Ripple (XRP) has shown relative stability, with a modest loss of -0.48%, demonstrating that although a broad bearish bias has taken over the market, not all cryptocurrencies have experienced sharp declines.
- Over the past 10 weeks, all leading cryptocurrencies have maintained a dominant bearish trend, reflecting a persistent pattern of structural weakness. Cardano (ADA) remains the most affected, with a -38.05% drop, while Bitcoin (BTC) has shown more resilience, falling -12.92%, suggesting that the market’s benchmark cryptocurrency has attempted to cushion the most aggressive downward moves in the medium term.
- On a year-to-date basis, Ripple stands out as the best-performing cryptocurrency of 2025, gaining 11.29%, while Dogecoin (DOGE) remains the worst performer, with a -48.26% loss, erasing nearly half of its value since the start of the year, confirming it as one of the most heavily hit assets in the market.
- Bitcoin has continued to post lower lows, with prices falling below the $100,000 level per BTC, reinforcing the dominance of selling pressure, which is likely to persist in the short term.
- Overall, the market faces steady bearish pressure, with Bitcoin and other cryptocurrencies recording three or more consecutive losing sessions, establishing the selling bias as the prevailing trend.
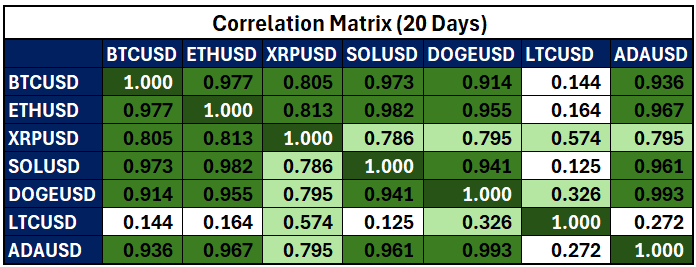
Colors range from red to green – red indicates negative correlations, and green indicates positive correlations.
Source: Data - StoneX, Tradingview
Since the beginning of the current bearish cycle, most major cryptocurrencies have maintained a strong positive correlation with Bitcoin, with correlation coefficients above 0.8, indicating a tight relationship in short-term price movements. However, Litecoin (LTC) has partially decoupled from Bitcoin’s pattern, with a correlation of just 0.14, meaning that while Bitcoin has faced consistent depreciation, Litecoin has managed to record notable upward corrections, distinguishing itself from the broader market trend.
Nonetheless, despite these isolated movements, the overall bearish sentiment continues to dominate the crypto market. As Bitcoin’s weakness persists, other cryptocurrencies tend to mirror its behavior, reinforcing a broad environment of structural uncertainty. If the leading cryptocurrency fails to regain investor confidence, others are likely to experience continued declines in the short term.
It is important to note that these correlation coefficients may vary over time as new information enters the market.
Is Bitcoin’s Downtrend Strengthening?
Source: StoneX, Tradingview
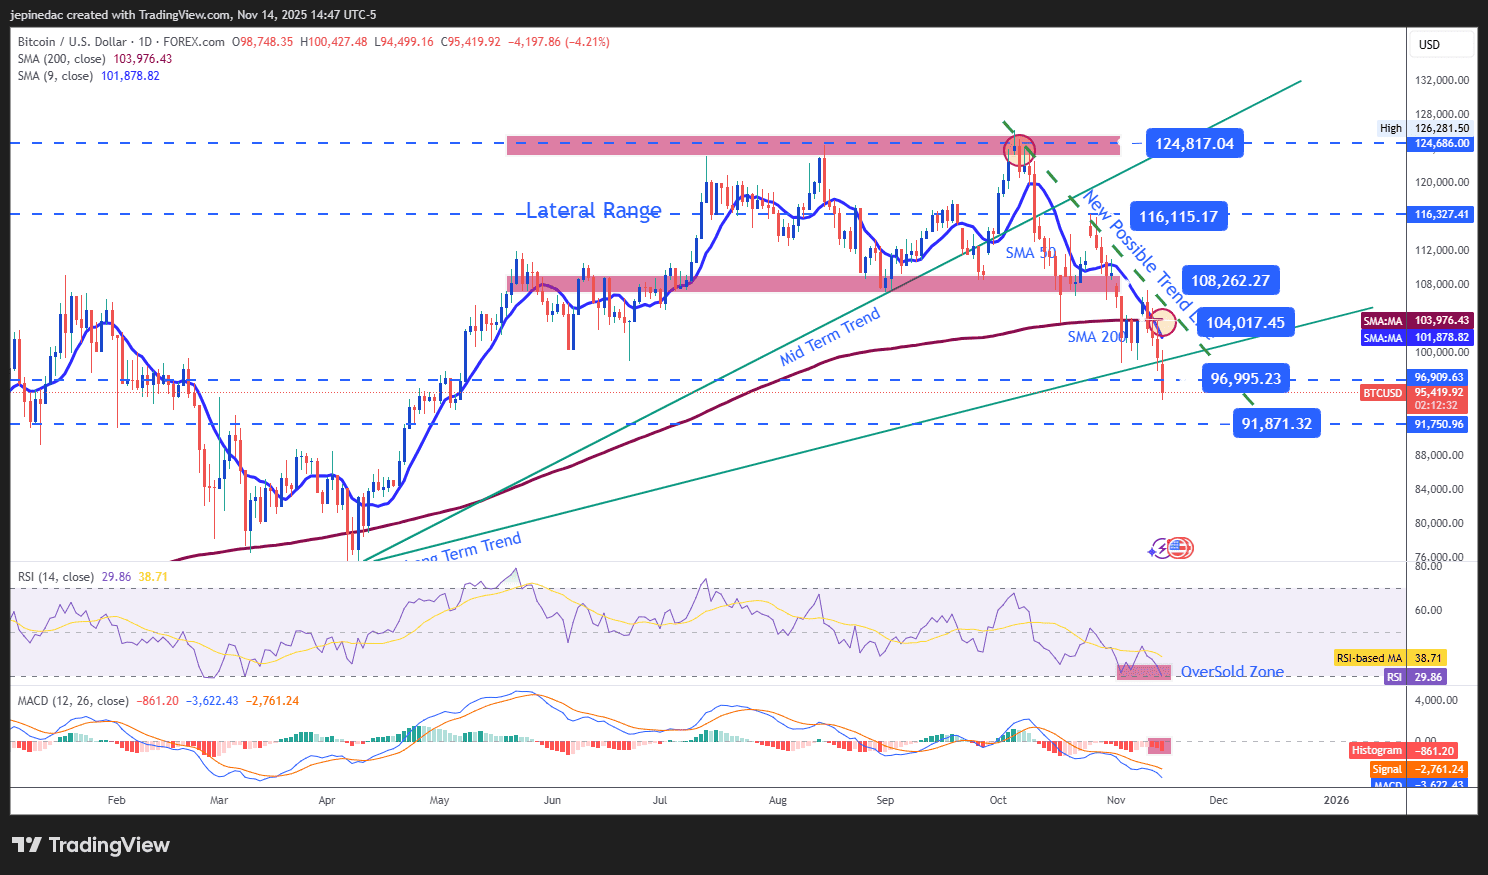
As the week ends, Bitcoin continues to display a pronounced bearish pattern, holding a firm selling bias after breaking below the key support at $100,000 per BTC. Selling activity has extended a steady downward trendline that has been in place since early October, and as long as the price remains below the 200-period moving average, selling pressure is likely to remain dominant, driving the asset toward new short-term lows.
Indicators:
- Both the RSI and MACD remain below their neutral levels (50 and 0, respectively), reflecting a consistent selling momentum. However, the RSI is hovering near the oversold zone (30), which could indicate an excessive bearish condition that may lead to temporary corrective rebounds in the short term.
Key Levels to Watch:
- $104,000 – Major Resistance: This level marks the most important resistance area in the short term, where the 200-period and 50-period moving averages converge. A recovery to this level could challenge the existing downtrend and temporarily reactivate a bullish bias.
- $96,995 – Nearby Barrier: This retracement zone, not seen since May, could serve as a tentative resistance for short-term corrective rebounds.
- $91,871 – Key Support: This level corresponds to the January lows. If the price reaches and breaks below this area, it could trigger a sharper bearish trend in the coming sessions.
Ether Nears a Critical Support Zone
Source: StoneX, Tradingview
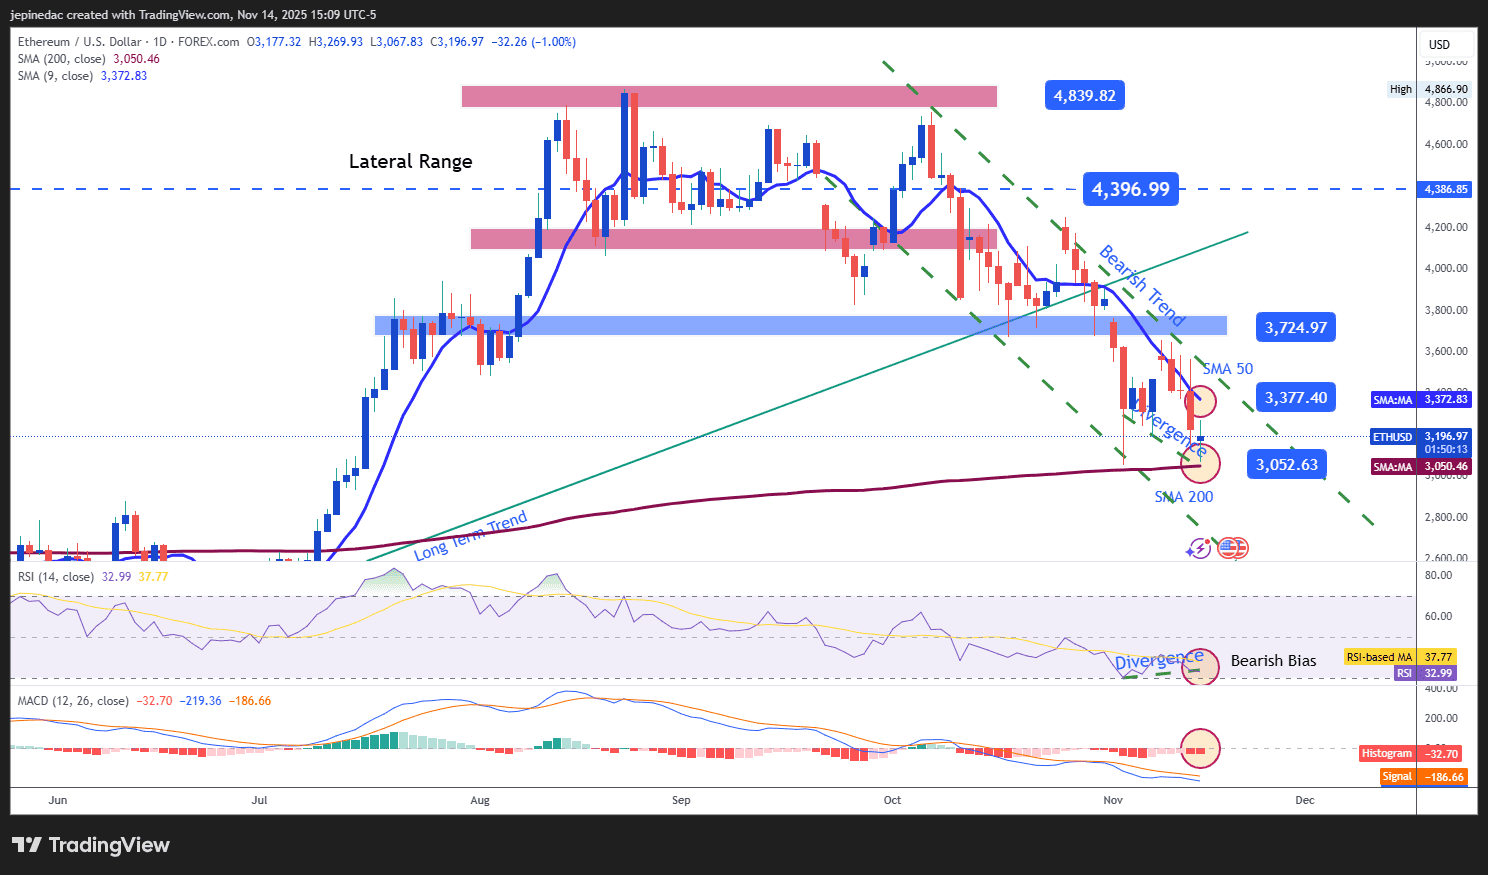
Ethereum (ETH) continues to show consistent selling pressure, trading below the 50-period simple moving average, confirming the sustained bearish momentum. This has led to the formation of a descending channel targeting the 200-period simple moving average, which serves as the most important technical support. If the price breaks below this level, the downward channel could strengthen further and dominate the asset’s behavior in the coming sessions.
Indicators:
- Both the MACD and RSI remain below their neutral levels (0 and 50, respectively), confirming short-term bearish strength. However, the RSI is showing an early bullish divergence, with higher lows in the indicator compared to lower lows in price, suggesting a potential technical rebound in the near term.
Key Levels:
- $3,724 – Major Resistance: This level represents a retracement zone not seen since mid-October, serving as the main resistance for upward moves. If the price reaches this area, it could trigger a bullish bias and challenge the current bearish structure.
- $3,377 – Nearby Barrier: Corresponds to the 50-period simple moving average, acting as immediate resistance for potential short-term rebounds.
- $3,052 – Key Support: This level aligns with the 200-period simple moving average. A break below it would mark a structural shift, potentially leading to a more aggressive downtrend in the short term.
Written by Julian Pineda, CFA, CMT – Market Analyst
Follow him on: @julianpineda25



The complete CFD trading experience
Award-winning platforms, competitive spreads, low commissions and dedicated support.
We live and breathe the markets and are dedicated to helping traders realise their ambitions as we continue to set the industry bar.
Economic calendar
Web Trader platform
Our sophisticated web-based platform is packed with features.
Related articles

Bitcoin Analysis: Is Uncertainty Returning to BTC?
Recent trading sessions have not been particularly supportive of a clear directional move in Bitcoin. This can be seen in the behavior of the price over the last four sessions, where fluctuations have remained close to 1.00% without establishing a consistent trend. As a result, a growing sense of neutrality is beginning to emerge around BTC.

Gold Dips Below Three-Month Uptrend, Bitcoin Pulls Back from Nine-Month High
Gold has dipped below its three-month uptrend, while Bitcoin has pulled back from a nine-month high as U.S. bond yields test levels last seen in 2004 and 2007. Risks build as Fed rate-hike expectations remain above 70%, while the Dollar Index holds near yearly highs.


Crypto Outlook: Altcoins Lead the Rally as Bitcoin Pauses
With only a few days left in September, the cryptocurrency market continues to show a constructive short-term outlook. The latest trading week has delivered meaningful gains across most major digital assets and, broadly speaking, the bullish bias remains the dominant force within the market.
StoneX Europe Ltd may make third party material available on this website which may contain information included but not limited to the conditions of financial markets. The material is for information purposes only and does not contain, and should not be construed as containing, investment advice and/or investment recommendation and/or an investment research and/or an offer of or solicitation for any transactions in financial instruments; any decision to enter into a specific transaction shall be made by the client following an assessment by him/her of their situation.
StoneX Europe Ltd makes no representation or warranty and assumes no liability as to the accuracy or completeness of the information provided, nor any loss arising from any investment based on a recommendation, forecast or other information supplied. You should always seek independent advice as to your suitability to speculate in any related markets and your ability to assume the associated risks, if you are at all unsure. We are not under any obligation to update any such material. Any opinion made may be personal to the author and may not reflect the opinion of StoneX Europe Ltd.