au stock focus further potential downside pressure in rio tinto aided by fed 2688882017
Since the post U.S. presidential election on 09 November 2016, commodities related stocks had staged a remarkable rally triggered by hopes of a mega USD […]

Since the post U.S. presidential election on 09 November 2016, commodities related stocks had staged a remarkable rally triggered by hopes of a mega USD […]

Since the post U.S. presidential election on 09 November 2016, commodities related stocks had staged a remarkable rally triggered by hopes of a mega USD 1 trillion infrastructure spending plan proposed by U.S. President Trump.
However, since mid- February 2017, these commodities related stocks had decline by an average of 15% to 18% which almost gave back half the gains recorded from 09 November 2016 low. Interestingly, the recent decline seen in commodities related stocks such as Rio Tinto came in line with a recent USD strength revival seen at the end of January 2017 due to recent hawkish comments from key Fed officials and a sell-off in commodities especially in oil (refer to chart 1).
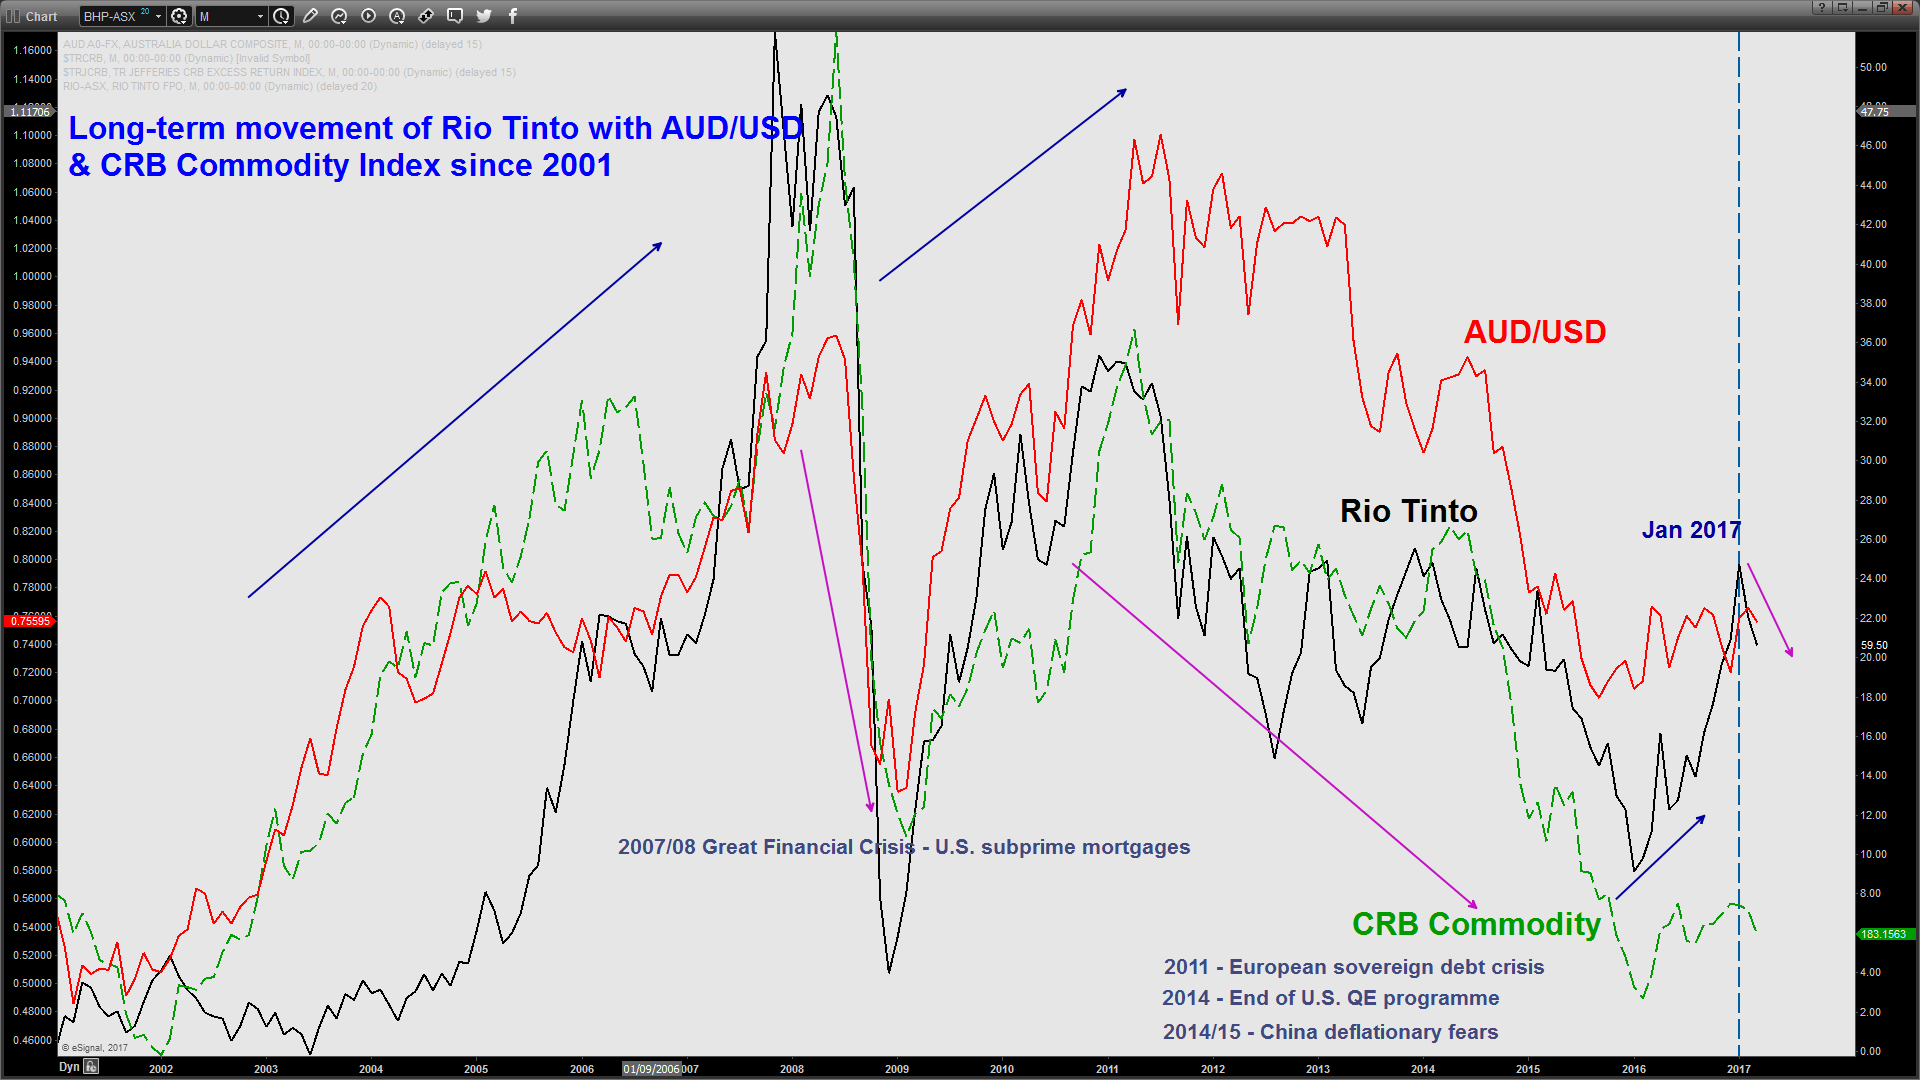 (Click to enlarge chart)
Therefore, this coming Wednesday (15 March 2017) U.S. Federal Reserve FOMC meeting will have a potential impact on the share price of Rio Tinto and other commodities related stocks in the short to medium-term. It is not the outcome of FOMC meeting that matters now as expectations based on the Fed fund futures pricing (as of 13 March 2017) from the CME FedWatch tool has indicated a probability of 94% that the Fed will hike another 25bps on 15 March 2017 to 75-100bps, a near certainty done deal. Right now, a potential factor that can move commodities related stocks after Wed’s FOMC is as follow;
If such change of tonality materialises, it may lead to a resurgence of USD strength and make commodities more expensive due to its pricing in USD which may lead to lower demand. As U.S. President Trump’s infrastructure spending plan lacks details and yet to be approved by Congress, thus in the short to medium-term (1 to 3 weeks), a USD strength revival can create a negative feedback loop and add further potential downside to commodities related stocks.
In addition, WTI crude oil futures had started to fall steeply in the recent two weeks due to increasing supplies from U.S. shale producers and broke below the key long-term support zone of 50.00/49.60 per barrel. If there is another price war that breaks out between OPEC and U.S. shale producers after the Saudis engineered production cut agreement between OPEC and non-OPEC nations ends in June 2017, oil prices are likely to tumble further and next major support for the WTI crude oil rests at the 37.20/36.50 zone. A further weakening of oil price is going to bring back the “dark days” of 2015/16 that is likely not to bode well for commodities related stocks.
Now, let us take a look at one of major commodities related stocks, Rio Tinto from a technical analysis perspective
 (Click to enlarge chart)
Intermediate resistance: 62.30/63.02
Pivot (key resistance): 65.60
Supports: 56.26 & 55.30
Next resistance: 69.80
Rio Tinto may see a minor rebound at this juncture towards 62.30/63.02 before another potential downleg materialises to target the next supports at 56.26 and 55.30.
However, a clearance above the 65.60 pivotal resistance is likely to invalidate the preferred bearish tone for a further push up to retest the February 2017 swing high at 69.80
Charts are from eSignal
Disclaimer
The material provided herein is general in nature and does not take into account your objectives, financial situation or needs. While every care has been taken in preparing this material, we do not provide any representation or warranty (express or implied) with respect to its completeness or accuracy. This is not an invitation or an offer to invest nor is it a recommendation to buy or sell investments. City Index recommends you to seek independent financial and legal advice before making any financial investment decision. Trading CFDs and FX on margin carries a higher level of risk, and may not be suitable for all investors. The possibility exists that you could lose more than your initial investment further CFD investors do not own or have any rights to the underlying assets. It is important you consider our Financial Services Guide and Product Disclosure Statement (PDS) available at www.cityindex.com.au, before deciding to acquire or hold our products. As a part of our market risk management, we may take the opposite side of your trade. GAIN Capital Australia Pty Ltd (ACN 141 774 727, AFSL 345646) is the CFD issuer and our products are traded off exchange.





