
- Australian yield premium over the United States evaporates
- US economic surprises hit three-year highs
- RBA–Fed policy divergence pressures the Aussie
- AUD/USD breakdown leaves 0.6750 in focus
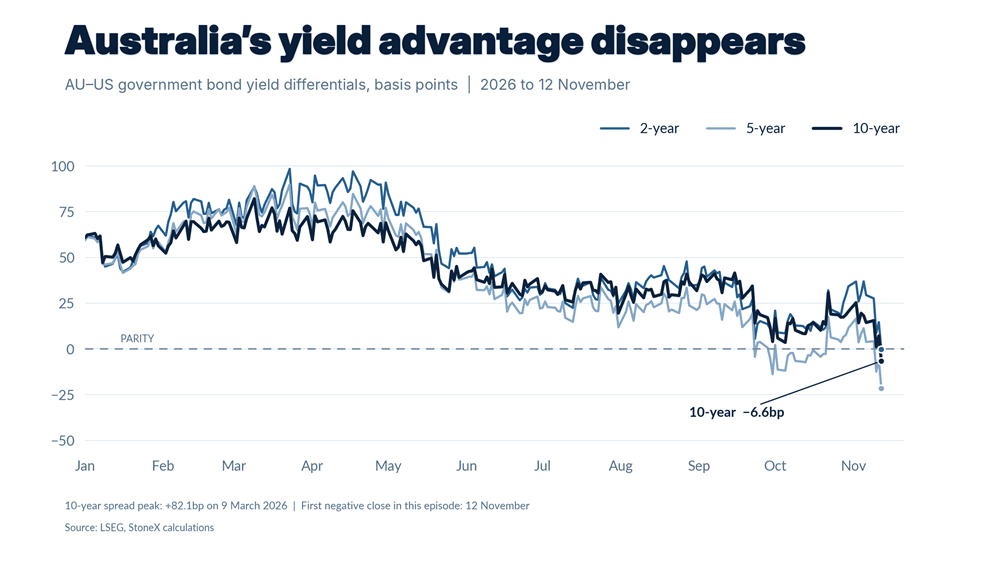
Australia’s yield advantage over the United States has evaporated, coinciding with a steep decline in AUD/USD to levels not seen since the beginning of the year.
The move has coincided with an unusually large surge in US Treasury yields and a stronger US dollar, reflecting shifting monetary policy expectations and a broader risk-off tone across financial markets.
Australian yield premium wiped out
Source: LSEG
Benchmark Australian 10-year government bond yields fell below their US equivalent on Thursday for the first time in nearly 15 months. While that partially reflects the Veterans Day holiday in the United States, which saw cash Treasury markets closed while Australian bonds continued trading, it doesn't diminish the broader trend that has seen Australia's yield advantage over the US collapse across large swathes of the yield curve.
Source: LSEG
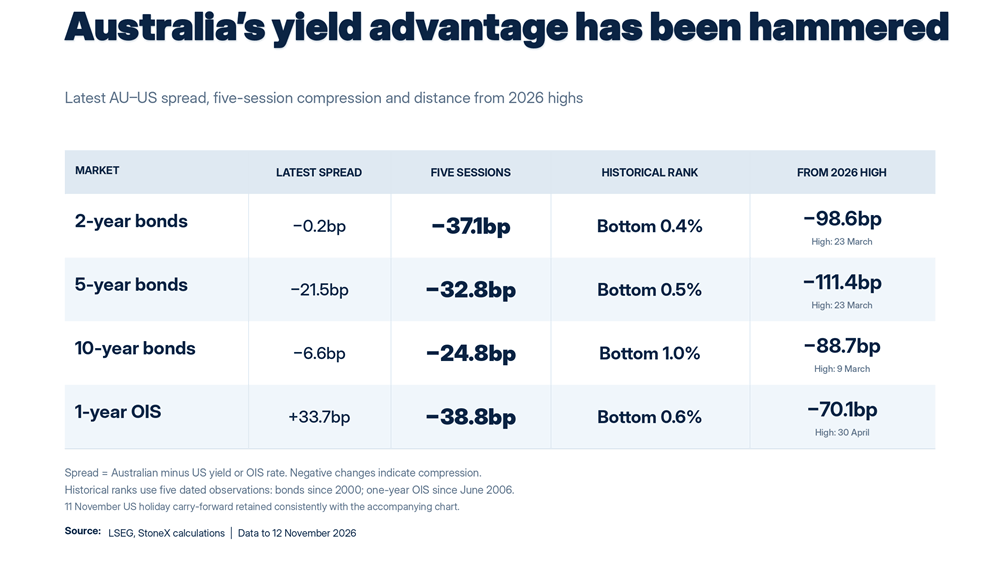
As seen in the table above, two, five and 10-year yield differentials between Australia and the US have narrowed by 98.6, 111.4 and 88.7 basis points, respectively, from their 2026 highs.
Source: LSEG
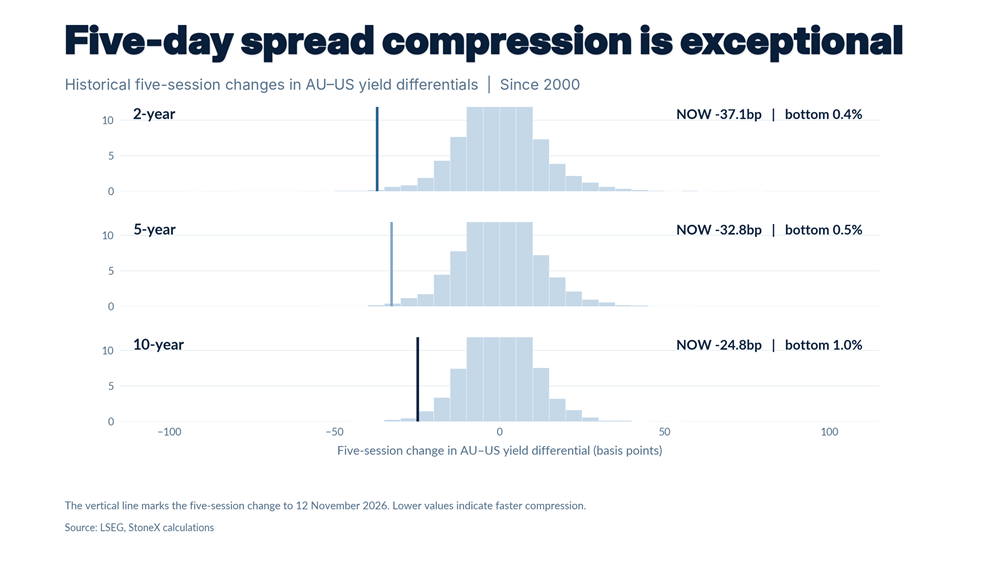
It's not just the scale of the compression that has been eye-opening, but also the speed, with the moves over the past five sessions ranking among the largest 1% of comparable moves since 2000.
Economic data reinforce the RBA–Fed divide
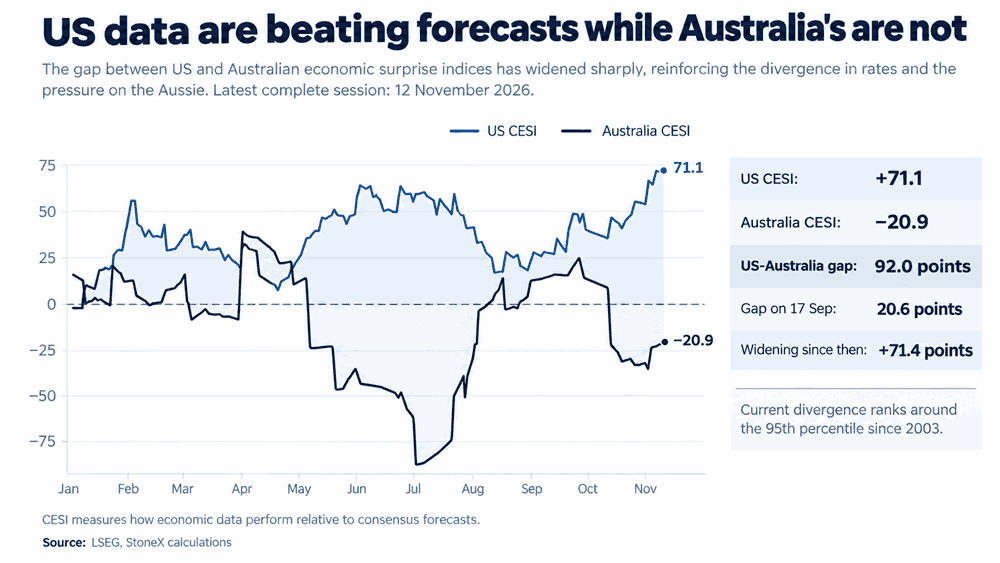
The collapse in yield spreads coincides with a rapidly diverging performance between the Australian and US economies, at least relative to economists' expectations, as seen in the graphic below.
Source: LSEG
The US Citi Economic Surprise Index has surged to its highest level since August 2023, indicating that the balance and magnitude of positive economic surprises have reached levels not seen in several years. That contrasts sharply with the Australian index, which remains in negative territory, indicating that economic surprises have been skewed to the downside relative to forecasts.
The gap between the two indices has widened to 92 points, around the 95th percentile of all readings dating back to 2003, helping to partially explain the dramatic recalibration in relative interest rate expectations between the two countries.
RBA nearing the finish line, Fed far from done
The divergent economic performance has been mirrored in the recent evolution of policy rate expectations in Australia and the US. Despite delivering another rate hike last week, the RBA's decision was widely interpreted as dovish, with the bank dropping forward guidance on the need for further tightening, while a 6–3 board split highlighted a lack of consensus on the policy outlook.
Contrast that with the Federal Reserve, where markets are pricing at least another 75 basis points of hikes by the third quarter of next year. An entire 25-basis-point increase has been added to the curve this week alone, following an upside surprise in the October US CPI report and hawkish commentary from influential Fed Governor Christopher Waller.
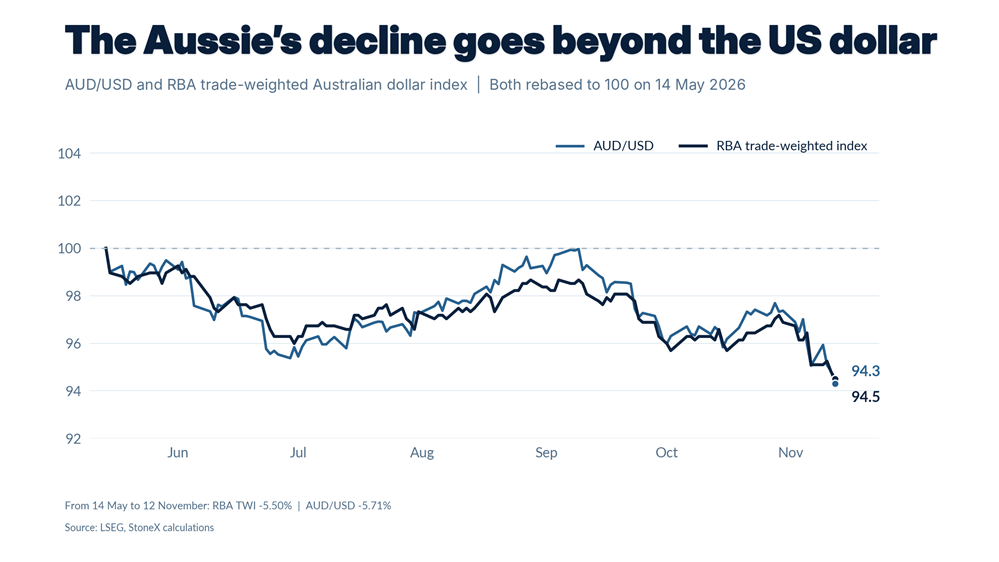
Aussie weakness extends beyond the US dollar
Source: LSEG
While the hawkish recalibration in the Fed interest rate outlook has contributed to the decline in AUD/USD, the weakness is not just a US-centric phenomenon. As seen in the graphic above, the RBA's trade-weighted Australian dollar index has fallen 5.5% from its May high, demonstrating the broader nature of the sell-off.
The collapse in Australia's relative interest rate advantage has undoubtedly been a factor, but softer industrial metals prices and deteriorating risk appetite compared with earlier in the year have also weighed on the currency, leaving the Aussie under pressure on multiple fronts.
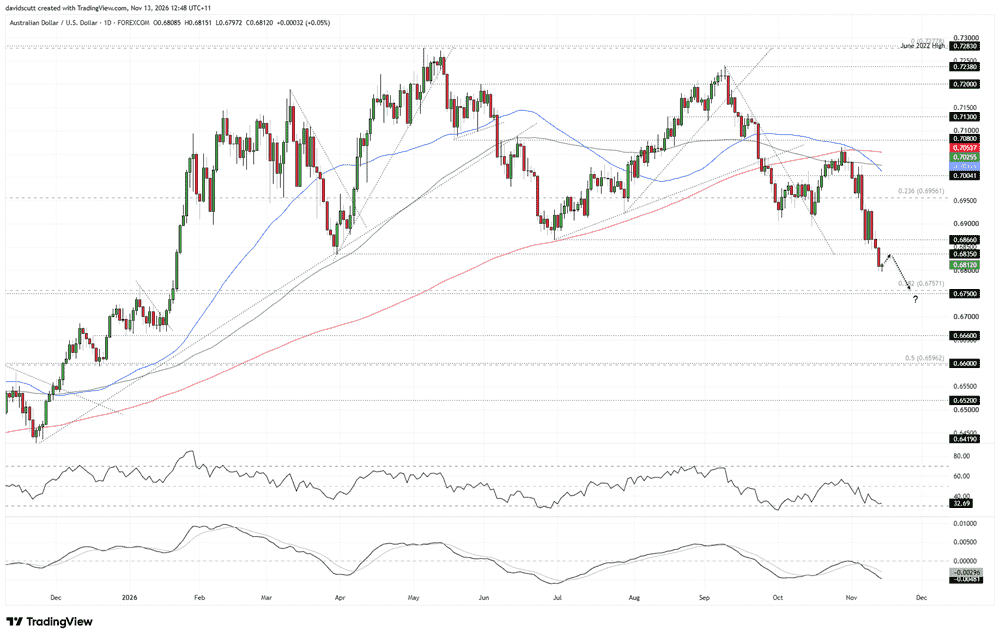
AUD/USD bears eye 0.6750
Source: TradingView
The enormous hawkish recalibration in the Fed interest rate outlook this week has seen AUD/USD break beneath 0.6866 and 0.6835, swing lows established in June and March this year, leaving the price trading at levels not seen since late January.
While bids have emerged beneath 0.6800, the breakdown below 0.6835 has left the Aussie in something of a vacuum between that level and a more substantial support zone comprising the 38.2% Fibonacci retracement of the advance from the 2025 low to the 2026 high at 0.6757, along with horizontal support at 0.6750, a level that has acted as both support and resistance on numerous occasions over recent years.
With that in mind, a rally back towards 0.6835 without a meaningful reversal in the Fed interest rate outlook would present a potential sell-on-rallies opportunity. That view is reinforced by the momentum indicators, with RSI (14) continuing to establish lower highs and lower lows since late October, suggesting downside momentum is building. MACD tells a similar story, having staged a bearish crossover in negative territory while continuing to diverge from the signal line.
Although the price is approaching oversold territory, the technical picture continues to favour selling rallies rather than buying dips. A sustained reclaim of 0.6866 could shift directional risks sideways to higher, particularly given the price action seen earlier this year, but we're not at that point yet.