





AUD/USD Recovery Pulls RSI Away from Oversold Territory
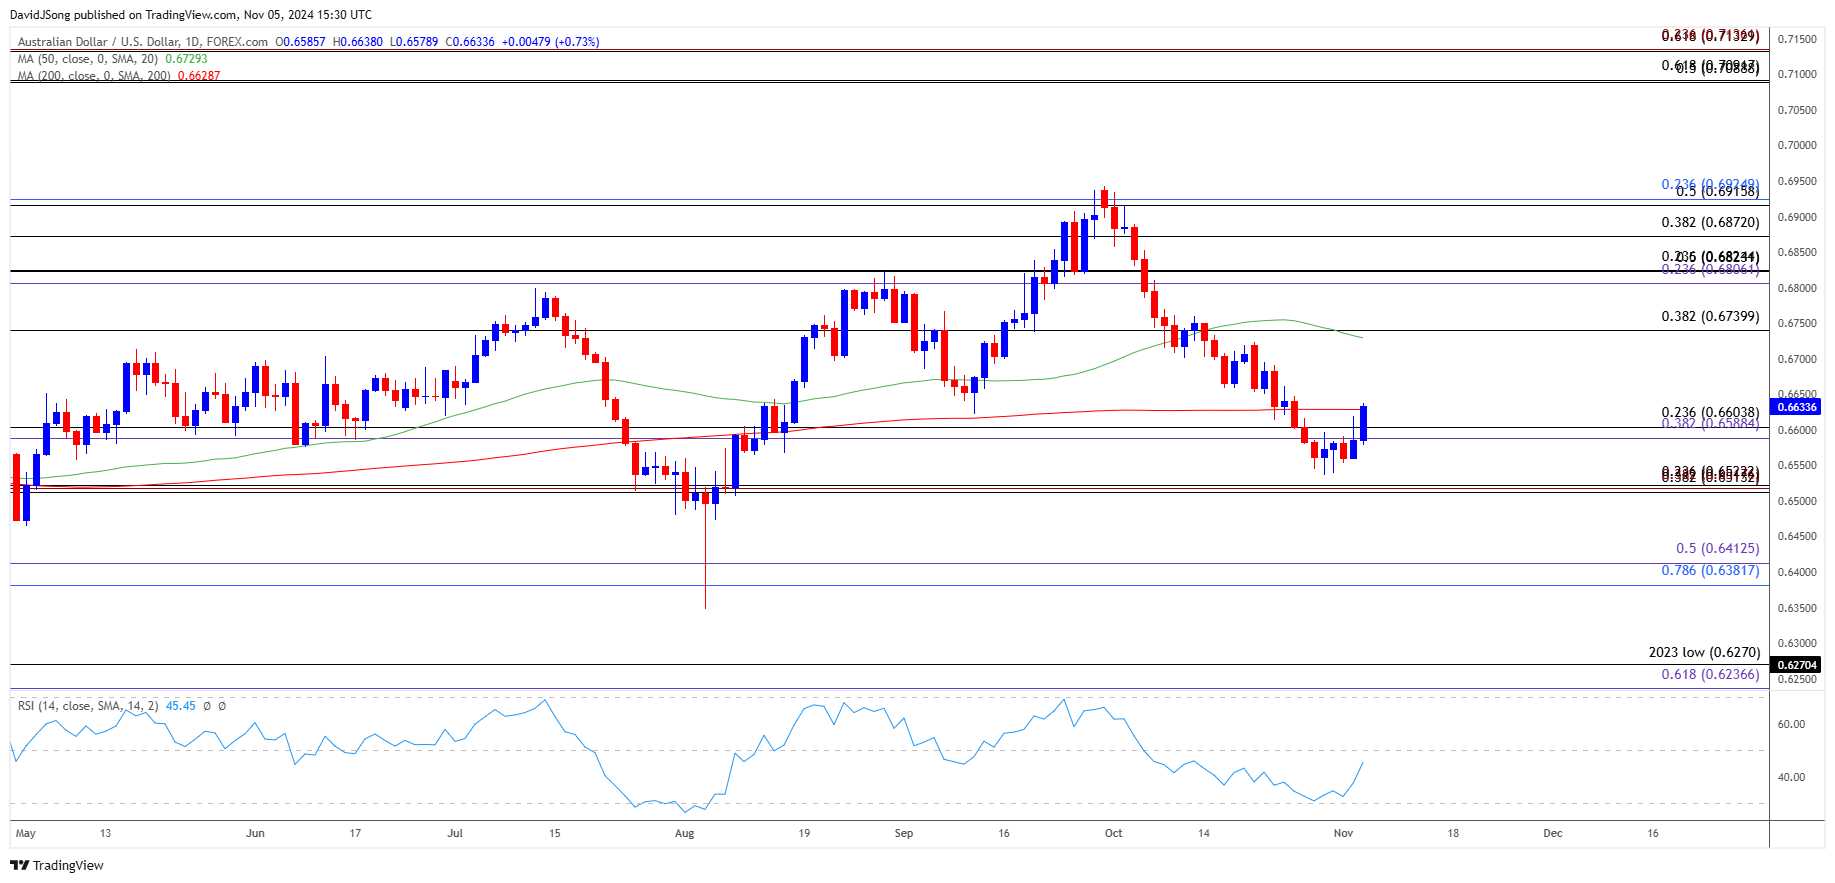
The recent recovery in AUD/USD kept the RSI above 30, and the oscillator may continue to show the bearish momentum abating as it moves away from oversold territory.
Share this:

Australian Dollar Outlook: AUD/USD
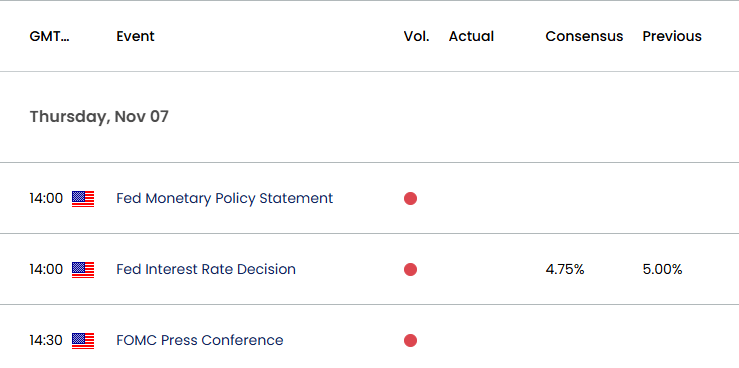
AUD/USD trades to a fresh weekly high (0.6638) after showing a limited reaction to the Reserve Bank of Australia (RBA) interest rate decision, and the exchange rate may appreciate over the remainder of the week as the Federal Reserve is expected to deliver a 25bp rate-cut.
AUD/USD Recovery Pulls RSI Away from Oversold Territory
Keep in mind, the recent recovery in AUD/USD kept the Relative Strength Index (RSI) above 30, and the oscillator may continue to show the bearish momentum abating as it moves away from oversold territory.
Join David Song for the Weekly Fundamental Market Outlook webinar. David provides a market overview and takes questions in real-time. Register Here
As a result, AUD/USD may extend the recent series of higher highs and lows going into the Federal Open Market Committee (FOMC) meeting, and the looming decision by Chairman Jerome Powell and Co. may sway the exchange rate as the central bank pursues a neutral stance.
US Economic Calendar
The FOMC may continue to strike a dovish forward guidance even after reducing the benchmark interest rate to a fresh threshold of 4.50% to 4.75% as the central bank ‘projects that the appropriate level of the federal funds rate will be 4.4 percent at the end of this year.’
With that said, indications of a further Fed rate cuts may keep AUD/USD afloat especially as the RBA remains reluctant to switch gears, but the exchange rate may threaten the bullish price series should the central bank show a greater willingness to keep US interest rates on hold at its last meeting for 2024.
AUD/USD Price Chart – Daily
Chart Prepared by David Song, Strategist; AUD/USD on TradingView
- The opening range for November is in focus for AUD/USD as it trades back above the 0.6590 (38.2% Fibonacci extension) to 0.6600 (23.6% Fibonacci retracement) zone, with a break/close above 0.6740 (38.2% Fibonacci retracement) opening up the 0.6810 (23.6% Fibonacci extension) to 0.6820 (23.6% Fibonacci retracement) region.
- Next area of interest comes in around 0.6870 (38.2% Fibonacci retracement) but AUD/USD may snap the recent series of higher highs and lows if it struggles to hold above the 0.6590 (38.2% Fibonacci extension) to 0.6600 (23.6% Fibonacci retracement) zone.
- Failure to hold above the October low (0.6537) brings the 0.6510 (38.2% Fibonacci retracement) to 0.6520 (23.6% Fibonacci retracement) region back on the radar, with the next area of interest coming in around 0.6380 (78.6% Fibonacci retracement) to 0.6410 (50% Fibonacci extension).
Additional Market Outlooks
Monetary vs Fiscal Policy: Implications for FX Markets
USD/CAD Reverses Ahead of 2022 High with Fed Rate Decision on Tap
Euro Forecast: EUR/USD Recovery Persists Ahead of Euro Area CPI Report
British Pound Outlook: GBP/USD Recovery Emerges Ahead of UK Budget
--- Written by David Song, Senior Strategist
Follow on X at @DavidJSong
Related tags:
Latest market news




Open an account today
Experience award-winning platforms with fast and secure execution.
Economic calendar
Web Trader platform
Our sophisticated web-based platform is packed with features.
Related articles

silver-crash-2026-vs-2011-collapse
Silver has collapsed some 65% from its January peak, drawing uncomfortable comparisons with the 2011 crash. The parallels are striking, but a bigger bubble, a hawkish Federal Reserve and years of supply deficits make this episode different.


Nasdaq 100, SOX: Tech rout may be a symptom of something far larger
The financial tide is going out, and some of the market's biggest winners are being hammered. Our research suggests there's more to the tech rout than the AI headlines.

British Pound Short-term Outlook: GBP/USD 3% Plunge Hits 12-Month Low—Key Support in Focus 11 19 2026
Sterling’s October rebound has unraveled, leaving GBP/USD bears in control—but stretched momentum raises the stakes for the weekly close

From time to time, StoneX Financial Pty Ltd (“we”, “our”) website may contain links to other sites and/or resources provided by third parties. These links and/or resources are provided for your information only and we have no control over the contents of those materials, and in no way endorse their content. Any analysis, opinion, commentary or research-based material on our website is for information and educational purposes only and is not, in any circumstances, intended to be an offer, recommendation or solicitation to buy or sell. You should always seek independent advice as to your suitability to speculate in any related markets and your ability to assume the associated risks, if you are at all unsure. No representation or warranty is made, express or implied, that the materials on our website are complete or accurate. We are not under any obligation to update any such material.
As such, we (and/or our associated companies) will not be responsible or liable for any loss or damage incurred by you or any third party arising out of, or in connection with, any use of the information on our website (other than with regards to any duty or liability that we are unable to limit or exclude by law or under the applicable regulatory system) and any such liability is hereby expressly disclaimed.