
Australian Dollar Technical Outlook: AUD/USD Multi-Timeframe Analysis
Australian dollar technical analysis shows a third weekly drop after a Fibonacci resistance stall and a Fed-driven break of the June uptrend. Michael Boutros, StoneX Media Senior Market Analyst, walks through the Australian dollar across the weekly, daily and four-hour charts. The Federal Reserve decision fueled the drop that broke the AUD/USD uptrend in place since June, while daily RSI momentum sits at its lowest level since July. The video maps the Fibonacci confluence behind the reversal and the 200-day moving average. Event risk comes from the Australian employment report and trade talks on tariffs, rare earths and AI.
This content was created by an affiliate of FOREX.com and represents the views and opinions of the author/speakers, not the views and opinions of Forex.com, StoneX Group Inc., or its subsidiaries. The content has not been independently reviewed by FOREX.com.

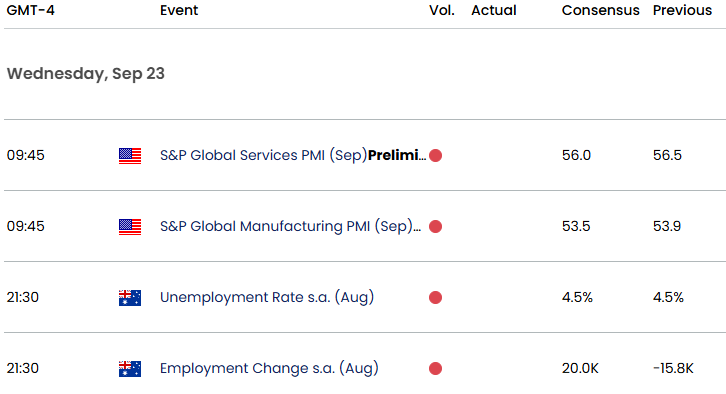
Key AUD/USD Economic Data Releases
Active Short-term Technical Charts
- British Pound Short-term Outlook: GBP/USD Selloff Breaks June Uptrend
- Canadian Dollar Short-term Outlook: USD/CAD Six-Day Rally Challenges Pivotal Resistance
- Australian Dollar Short-term Outlook: AUD/USD Reversal Tests Key Uptrend Support
- Gold Price Short-term Outlook: XAU/USD Bulls Fight to Stabilize at Pivotal Support
- Japanese Yen Short-term Outlook: USD/JPY Breakdown Faces Major Test Ahead of Fed, BoJ
- US Dollar Short-term Outlook: USD Selloff Accelerates Toward August Lows Ahead of NFP
- Swiss Franc Short-term Outlook: USD/CHF Breakout Puts Yearly Highs Back in Play
--- Written by Michael Boutros, Senior Technical Strategist
Follow Michael on X @MBForex