
Although Bitcoin seemed poised to start the week with confidence, a consistent selling bias has returned, with the cryptocurrency now posting a decline of more than 3% in the latest session. This correction is mainly driven by sustained selling pressure stemming from capital outflows in the BTC market. Despite attempts by the crypto market to stabilize sentiment, this improvement has yet to be reflected in Bitcoin’s price action. If this negative momentum persists in the short term, the bearish trend could gain further strength in the coming sessions.

Bitcoin Loses Appeal
Although market confidence has partially recovered since the beginning of the week — boosted by optimism over a potential end to the U.S. government shutdown — capital flows appear to have shifted toward traditional assets, leaving cryptocurrencies on the sidelines. As a result, Bitcoin has been unable to sustain strong short-term demand.
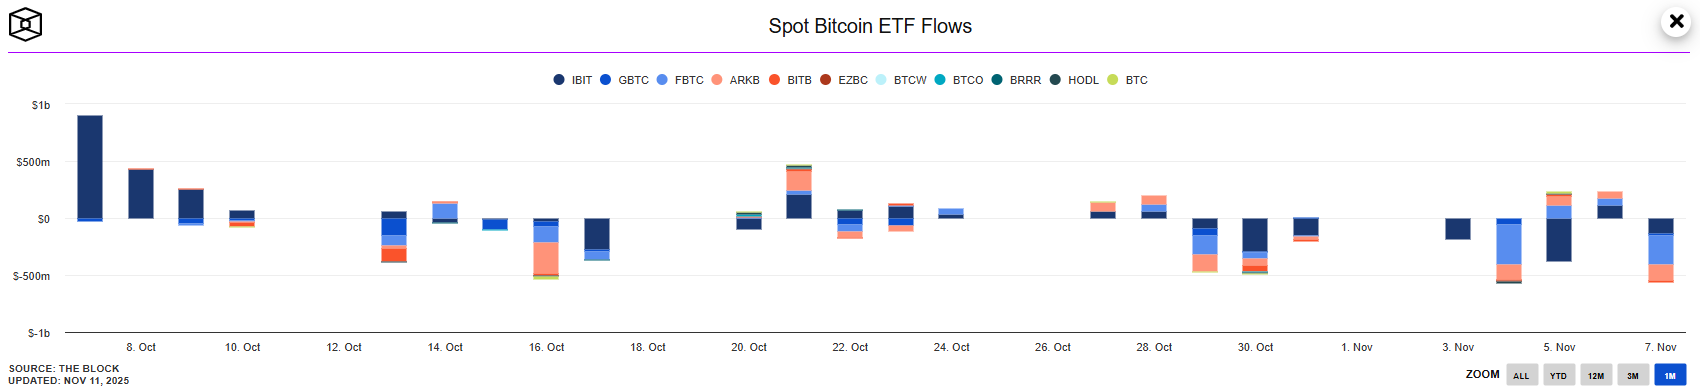
This is reflected in the performance of Bitcoin ETFs, which have once again shown negative flows. As of November 7, data shows capital outflows exceeding USD 500 million, highlighting a decline in institutional appetite for the asset. It is likely that some of this demand is being redirected toward traditional markets, leaving Bitcoin lagging in terms of short-term investor interest.
Source: Theblock
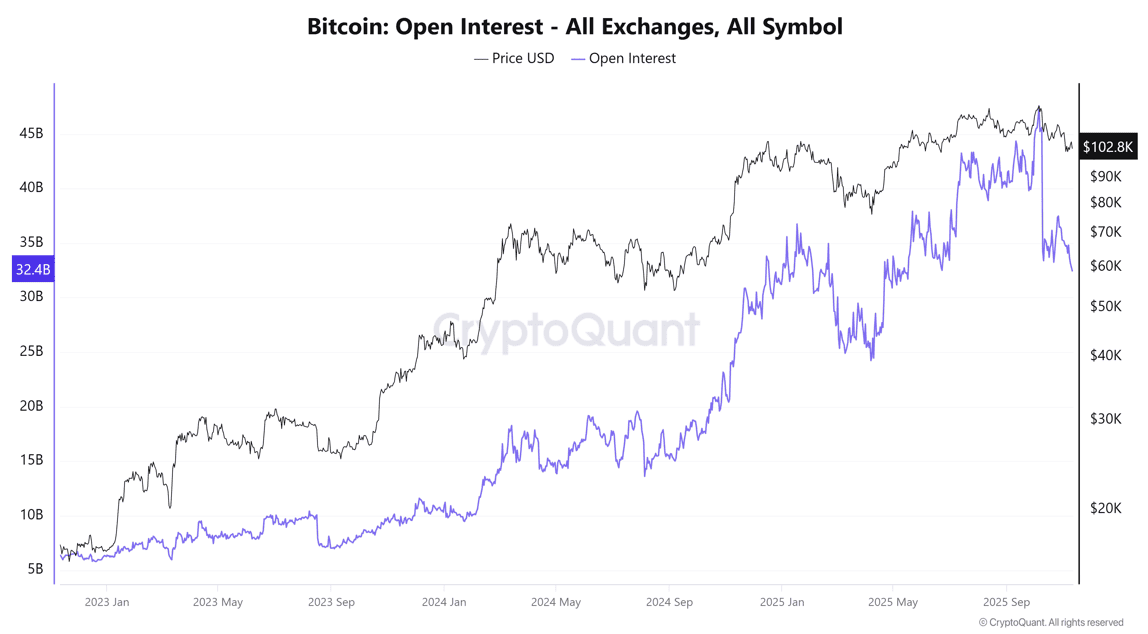
Additionally, the Open Interest indicator has registered its steepest decline in weeks, currently standing at around USD 32.4 billion, a level not seen since May of this year. This drop, along with Bitcoin’s continued price weakness, suggests a loss of long positions and a potential wave of profit-taking or a rotation of capital toward more attractive short-term markets.
Source: Cryptoquant
Consequently, Bitcoin is facing a notable loss of attractiveness, either due to investors’ preference for other risk assets such as equities, or because of profit-taking activity ahead of the year-end period. This has prevented the price from consolidating, leaving the cryptocurrency under persistent weakness that may continue to fuel selling pressure in the near term.
Crypto Market Sentiment
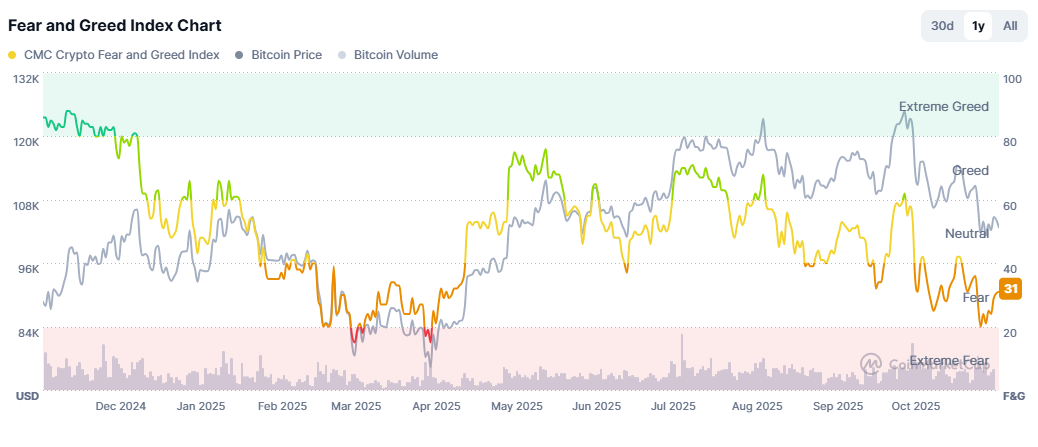
The Crypto Fear & Greed Index has attempted to recover in the short term, rising from levels near “extreme fear” to a more neutral zone, currently sitting at 31 points.
Source: Coinmarketcap
However, this improvement in sentiment has not yet been reflected in BTC’s price movements, suggesting a persistent lack of demand for the leading cryptocurrency. It is possible that capital is rotating into altcoins, reducing Bitcoin’s dominance. If this trend continues, BTC could lose further ground to other digital assets, maintaining steady selling pressure in the short term.
Technical Outlook for Bitcoin
Source: StoneX, Tradingview
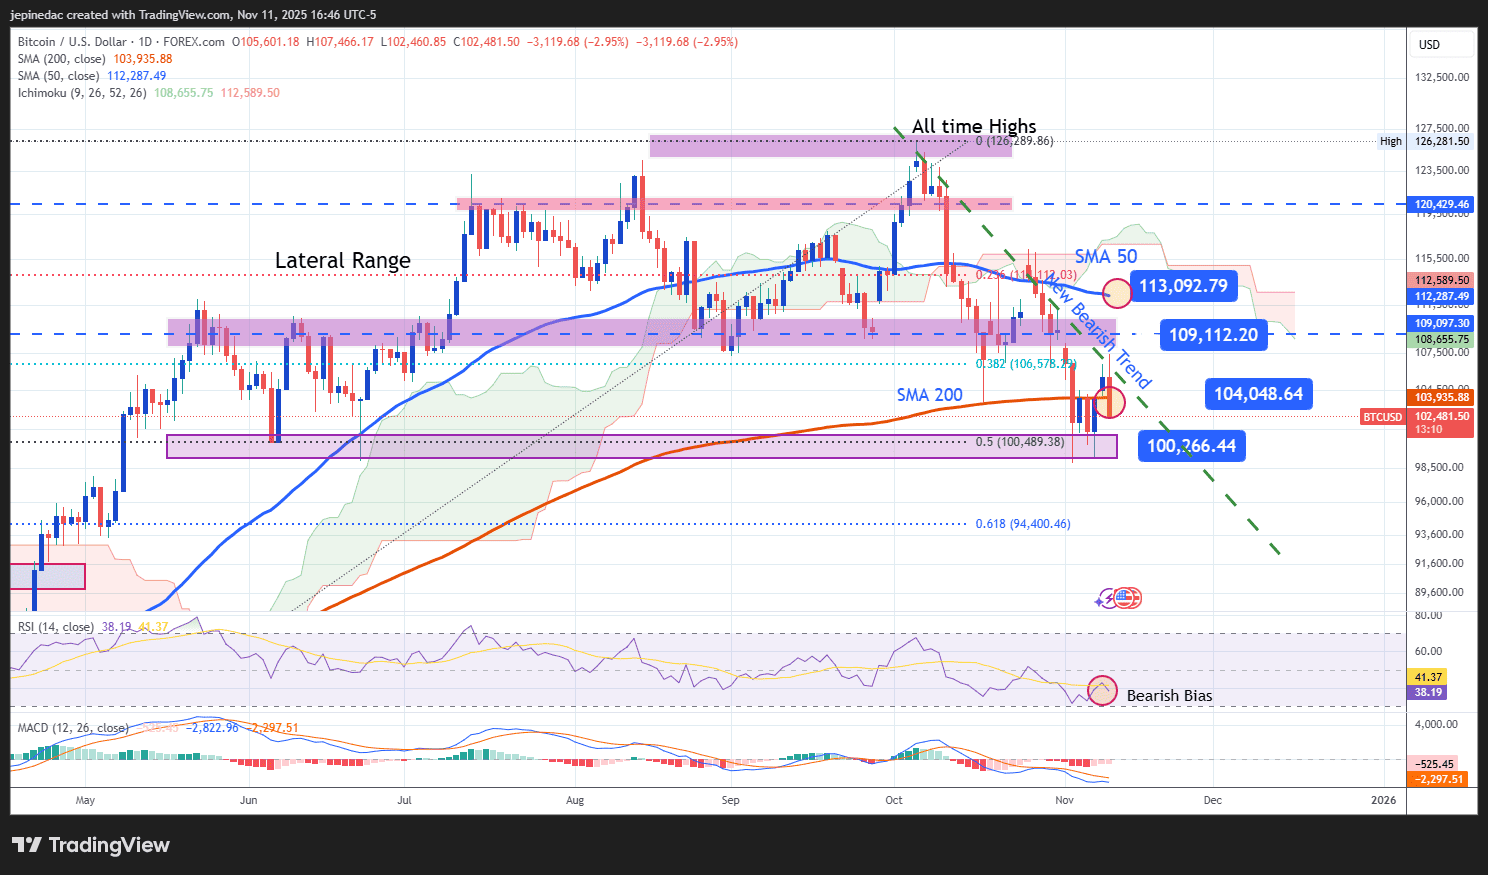
- Downtrend Gaining Strength: Since early October, Bitcoin has been forming lower highs, establishing a more defined downtrend line. Despite multiple rebound attempts, this structure remains intact and has become the dominant technical reference in the short term. As long as the price stays below the 200-period moving average, selling pressure is likely to persist, potentially leading to a stronger downward trend toward the medium term.
- RSI: The RSI indicator maintains a steady downward slope, with readings below the 50 level in the short term. This pattern shows that the average momentum over the past 14 sessions continues to display a broad bearish bias, highlighting ongoing technical weakness in the market. If the RSI continues to move lower, selling pressure could intensify, increasing the likelihood that BTC will extend its downward trajectory in the coming sessions.
- MACD: A similar pattern is observed in the MACD indicator, as the histogram remains consistently below the zero line. This suggests that the average strength of short-term moving averages continues to exhibit a bearish bias, reinforcing the likelihood that downward momentum will continue to dominate the market. Together, these signals indicate a scenario where selling pressure remains the dominant force in Bitcoin’s price action over the coming sessions.
Key Levels to Watch:
- 109,000 USD – Major Resistance: This level represents the most important retracement zone of recent weeks. A sustained recovery toward this area could test the downtrend line and temporarily trigger a bullish bias.
- 104,000 USD – Nearby Barrier: This zone coincides with the 200-period simple moving average. If the price remains near this area, a short-term sideways range could develop, marked by indecisive movements.
- 100,000 USD – Key Support: This is the most important psychological level on the chart. A breakdown below this level could accelerate the ongoing downtrend and reinforce the dominant bearish bias in the coming sessions.
Written by Julian Pineda, CFA, CMT – Market Analyst
Follow him on: @julianpineda25