During the first two trading sessions of the week, the price of BTC has shown a steady recovery, posting gains of just over 2.5% in the short term. This rebound has attracted market attention as it comes after a previous week dominated by selling pressure. Part of this momentum is due to the increase in open interest in the cryptocurrency market, reflecting the entry of new long positions and renewed investor interest. If this trend continues, buying pressure could become a decisive factor in sustaining the short-term recovery.

Is Interest in Bitcoin Growing Again?
The Open Interest indicator, which measures the total number of active futures contracts on Bitcoin, has shown an interesting recovery. It currently stands at $41.4 billion, compared with nearly $40 billion last week. This rebound not only indicates a higher volume of open positions but also suggests that many of them are long positions. The fact that this growth occurred alongside a rise in BTC’s price suggests that the fresh capital entering the market has done so with a bullish outlook.
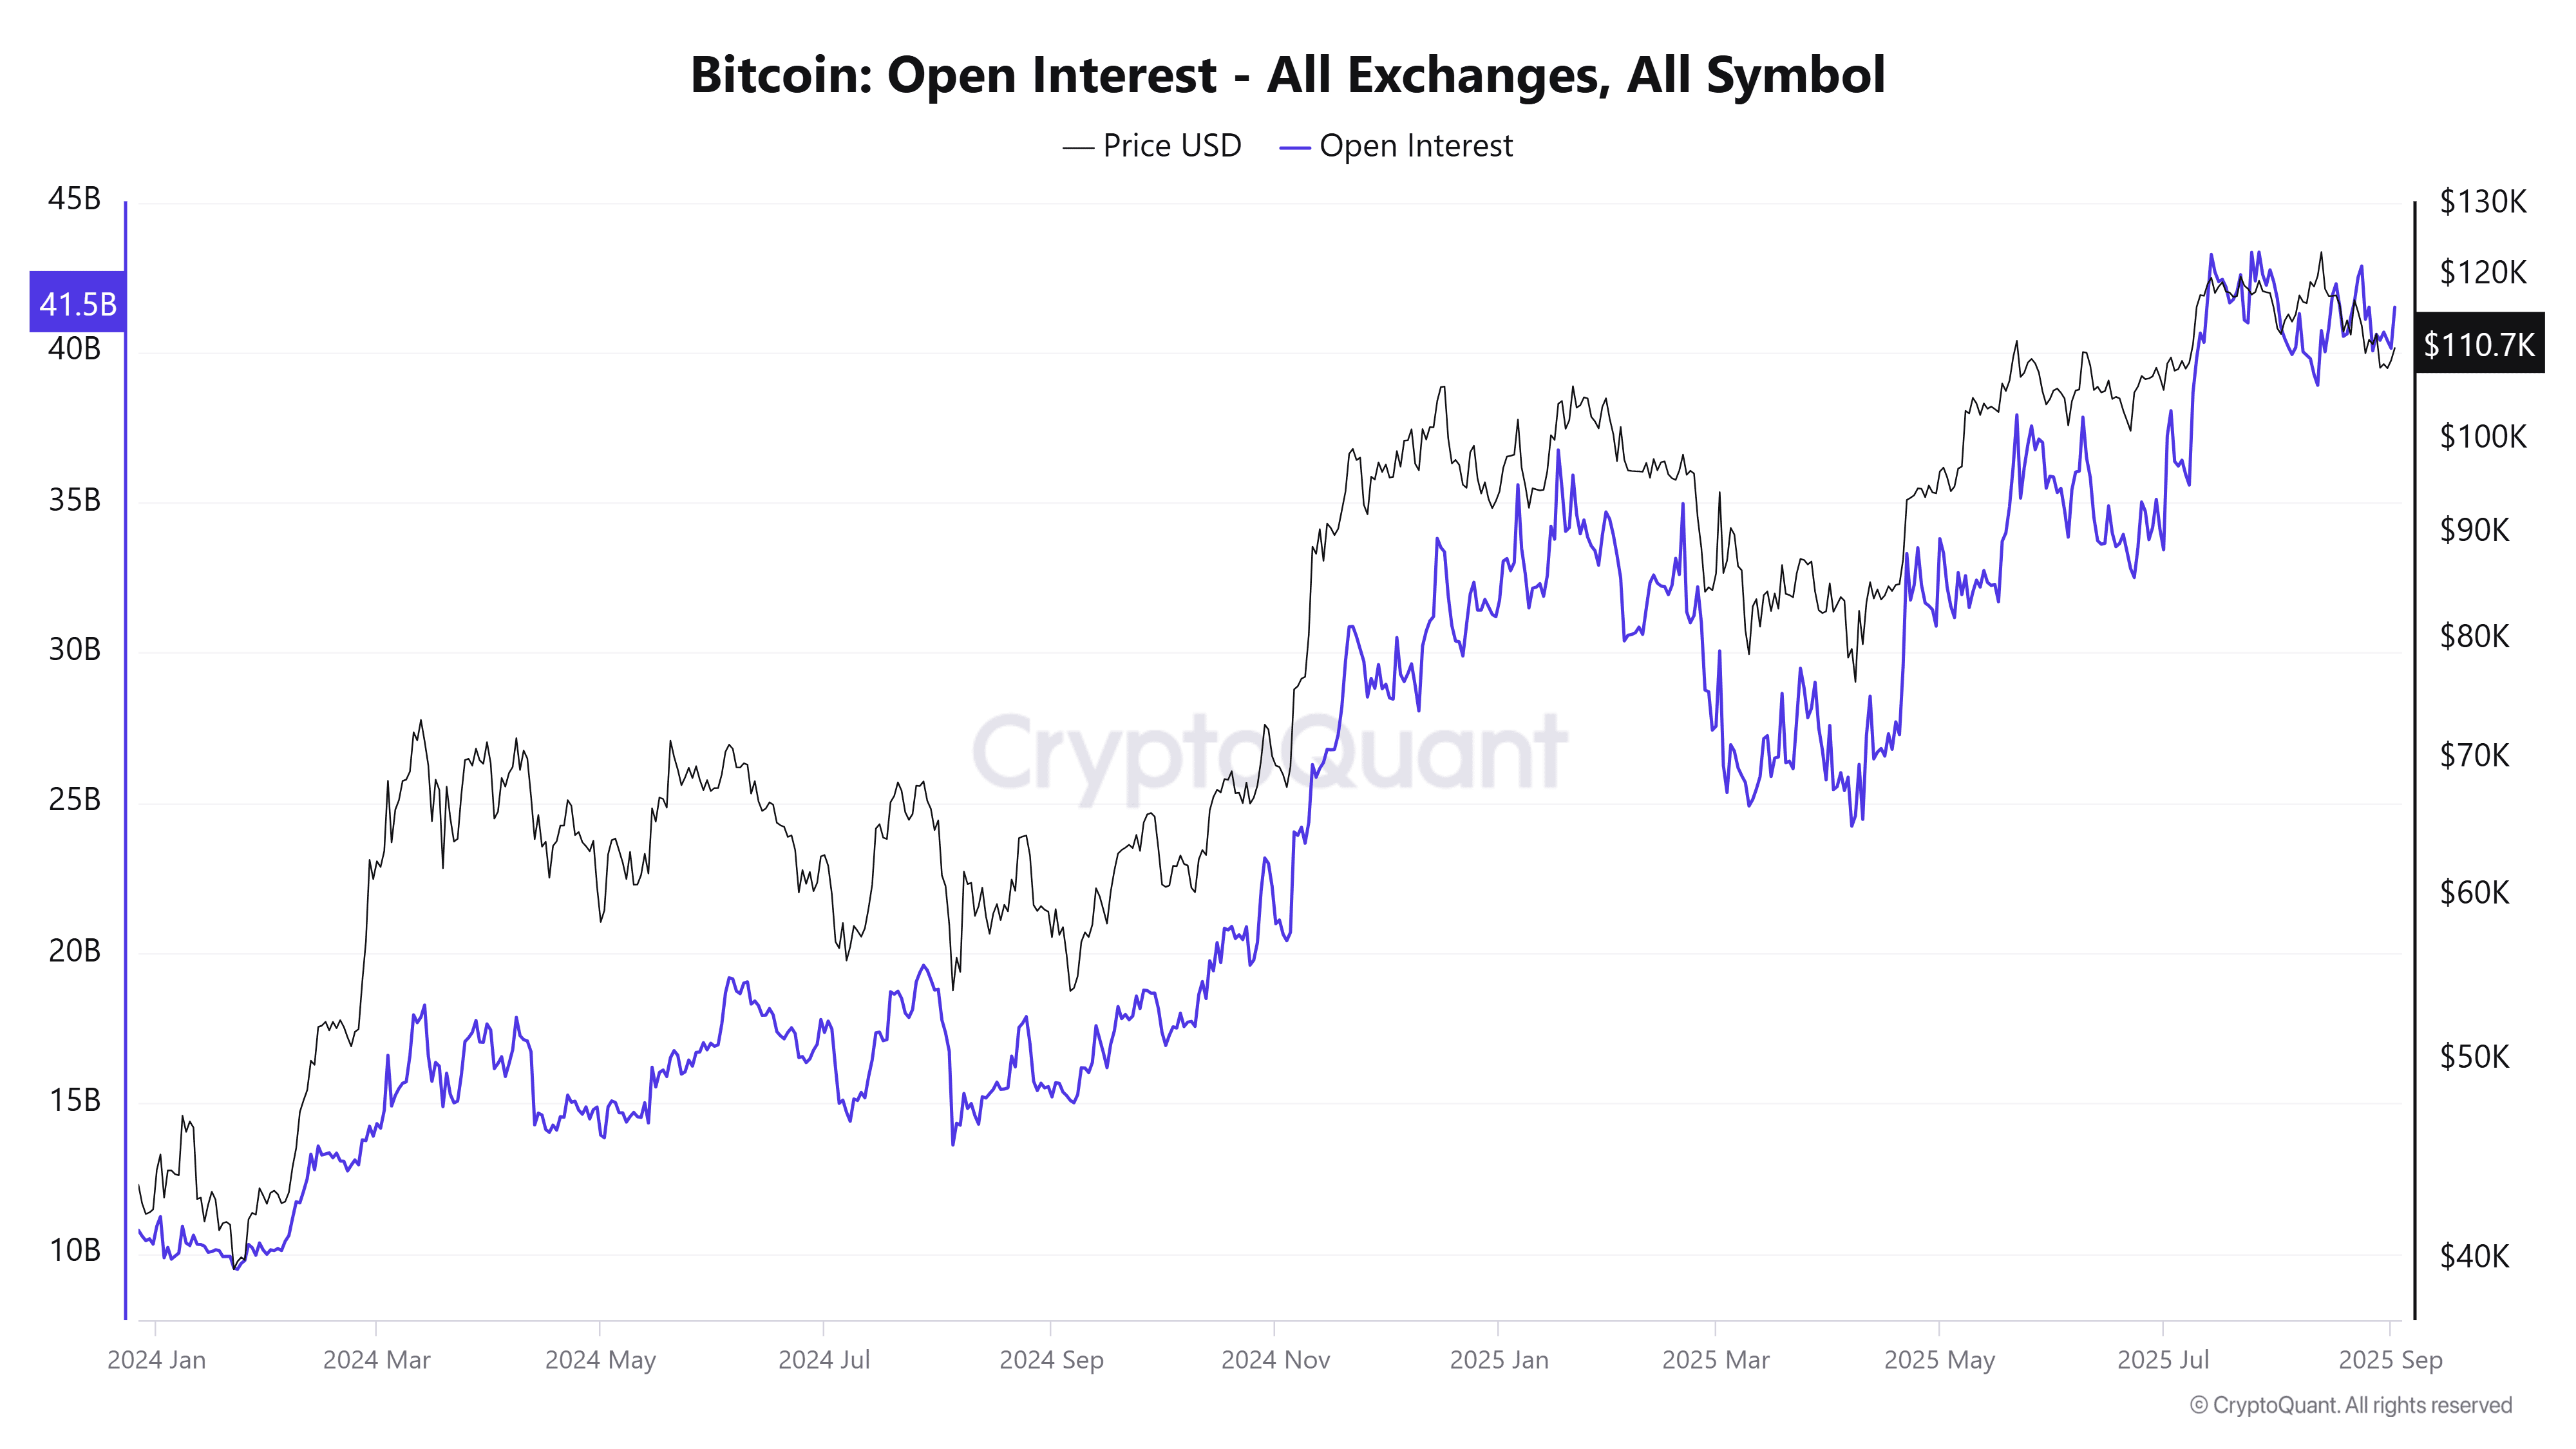
Source: Cryptoquant
This behavior is also linked to speculation surrounding upcoming U.S. macroeconomic data, particularly the NFP (nonfarm payrolls) report. The market perceives that if employment data shows weakness, the Federal Reserve could maintain a more flexible stance and continue with rate cuts. This is relevant because a lower-rate environment reduces the appeal of safe-haven assets such as Treasuries, while increasing market liquidity. In this context, investors tend to look for more speculative assets with higher potential returns, such as Bitcoin.
A low-rate environment has historically benefited assets like BTC, as it encourages capital flows into risk assets. In addition, expectations that rate cuts will remain in place create a “floor of confidence” in demand, which could support the continuation of the current rebound.
At the moment, the CME Group’s probability model indicates that for the September 17 meeting, there is a 91.6% probability that the interest rate will be reduced to 4.25%, from the current 4.5%. Unless employment data surprises to the upside, the market seems to assume that the Fed will continue on the path of cuts, a scenario that favors risk assets such as Bitcoin.
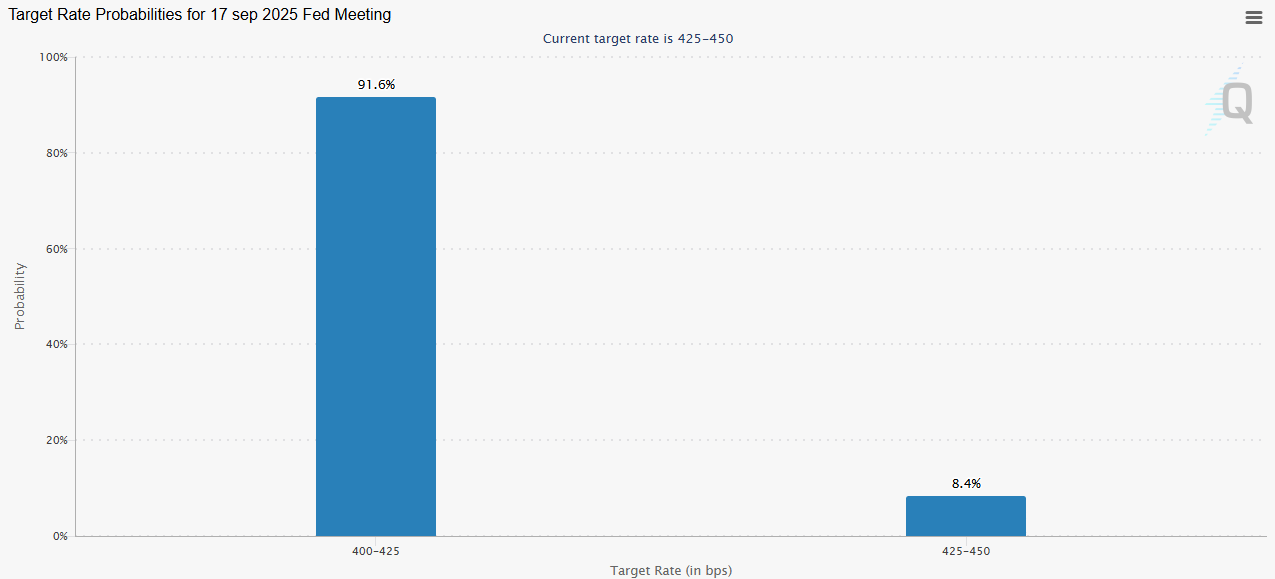
Source: CME Group
In this context, if open interest continues to grow alongside new long positions encouraged by expectations of lower rates, buying pressure could consolidate as a key pillar supporting the price in the short term.
What About Market Confidence?
Despite the price rebound, market sentiment does not seem to be fully aligned. The Fear & Greed Index for cryptocurrencies has continued to decline and is now in the “fear” zone, with readings near 39 points.
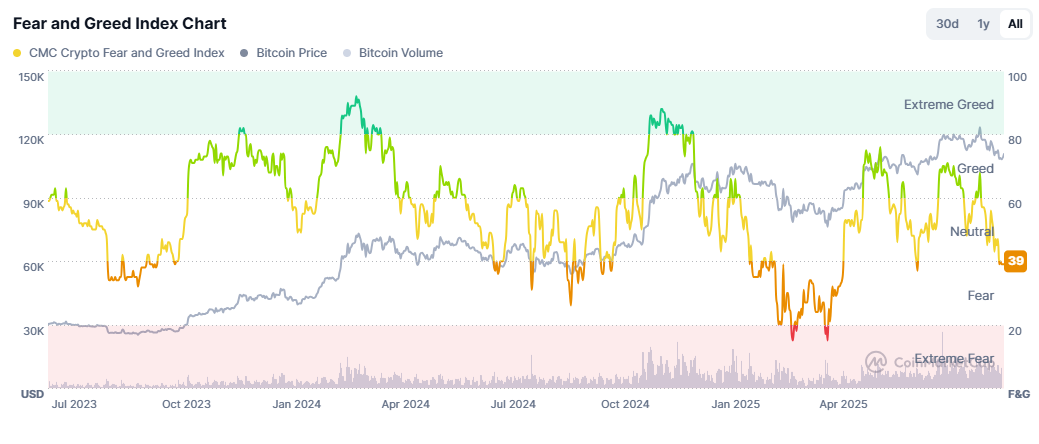
Source: Coinmarketcap
The persistence of this lack of confidence could limit the current buying pressure. If the indicator remains in fear territory, the lack of conviction in the market could open the door to a continuation of the bearish bias, as observed last week.
Bitcoin Technical Outlook
Source: StoneX, Tradingview
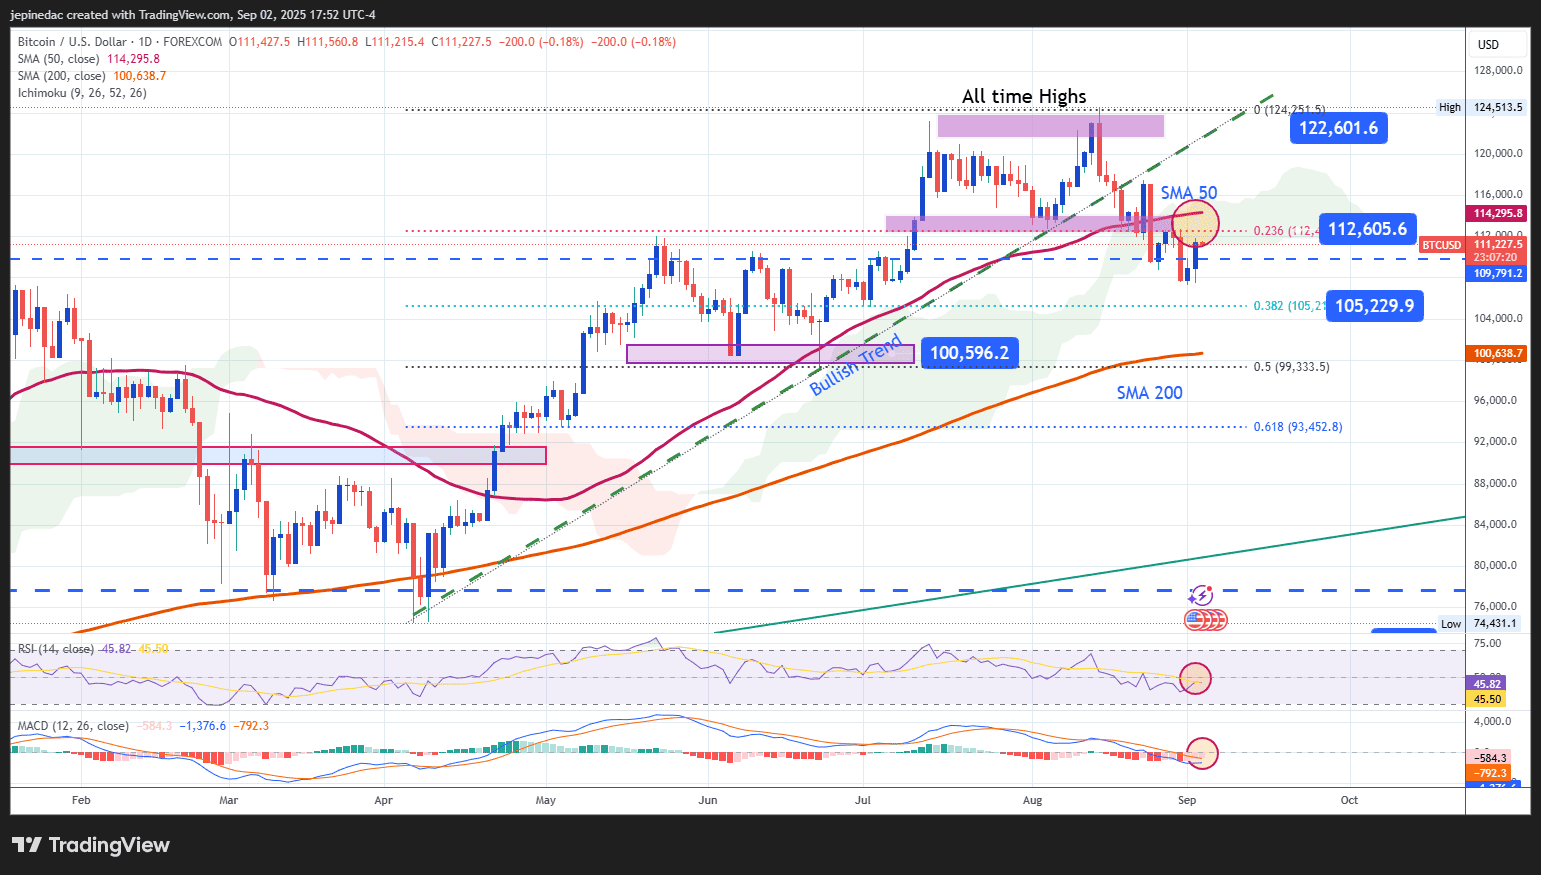
- Buying Pressure Emerges: Despite the bearish bias that dominated last week, the beginning of this week showed a resurgence of buying pressure, which pushed the price above $111,000. If this trend continues, the risk of another drop could diminish, and the price could return to the sideways range that had prevailed in recent months.
- RSI: currently remains near the neutral 50 level, suggesting a balance between buying and selling momentum. This lack of direction has been a consistent feature in recent weeks, and unless this level is broken, lateral movements are likely to prevail in the short term.
- MACD: the histogram remains around the 0 line, confirming that the average strength of moving averages is in neutral territory. This reinforces the idea that there is no clearly defined directional trend at the moment.
Key Levels:
- 122,600 – Major Resistance: corresponds to Bitcoin’s historical highs and represents the most important barrier for buyers. A return to this level could reignite a longer-term bullish trend.
- 112,600 – Near-Term Barrier: aligns with the 50-period moving average, the Ichimoku cloud, and the 23.6% Fibonacci retracement. This is a crucial level for current movements: as long as the price remains below it, the bearish bias will dominate the broader picture.
- 105,000 – Critical Support: corresponds to the 38.2% Fibonacci retracement. A break below this level would open the way for a deeper decline and confirm the formation of a more consistent bearish trend.
Written by Julian Pineda, CFA – Market Analyst
Follow him: @julianpineda25