
The final week of February begins, and with it a renewed short-term weakness bias in Bitcoin’s price action becomes more evident. The cryptocurrency has started the week with a drop of more than 4.5%, reinforcing a new bearish bias that once again dominates recent movements.
Selling pressure has regained relevance following the recent announcement of new global tariffs by the United States, which have reduced appetite for risk assets. Added to this is the persistent deterioration in crypto market confidence indicators, which remain at extreme lows. Both factors act as fundamental catalysts that do not support consistent short-term demand for Bitcoin and could continue sustaining downward pressure in the coming sessions.

New Tariffs Reduce Risk Appetite
On Friday, February 20, the United States Supreme Court ruled that the tariffs imposed last year by President Trump’s administration were illegal, arguing that the president does not have the authority to impose them without Congressional approval. This represented a significant setback for the current tariff policy and removed the legal basis for part of the duties that had been applied.
President Trump’s response was immediate. He initially announced a new global tariff of 10%, which he later raised to 15% over the weekend, using a 1974 legal framework that allows tariffs to be imposed for up to 150 days without additional Congressional approval. Following the announcement, several countries demanded greater clarity, and the European Union stated that these measures do not promote fair and balanced trade.
This context has once again increased global uncertainty and overall market risk perception. Tariffs can push prices higher and generate inflationary risks in the United States, which could eventually lead to a more aggressive stance by the Federal Reserve. In addition, risk aversion rises amid the possibility of trade retaliation and a renewed episode of global tensions. This environment has begun to affect the attractiveness of risk assets, including Bitcoin, as investors may shift toward assets considered more stable in the short term.
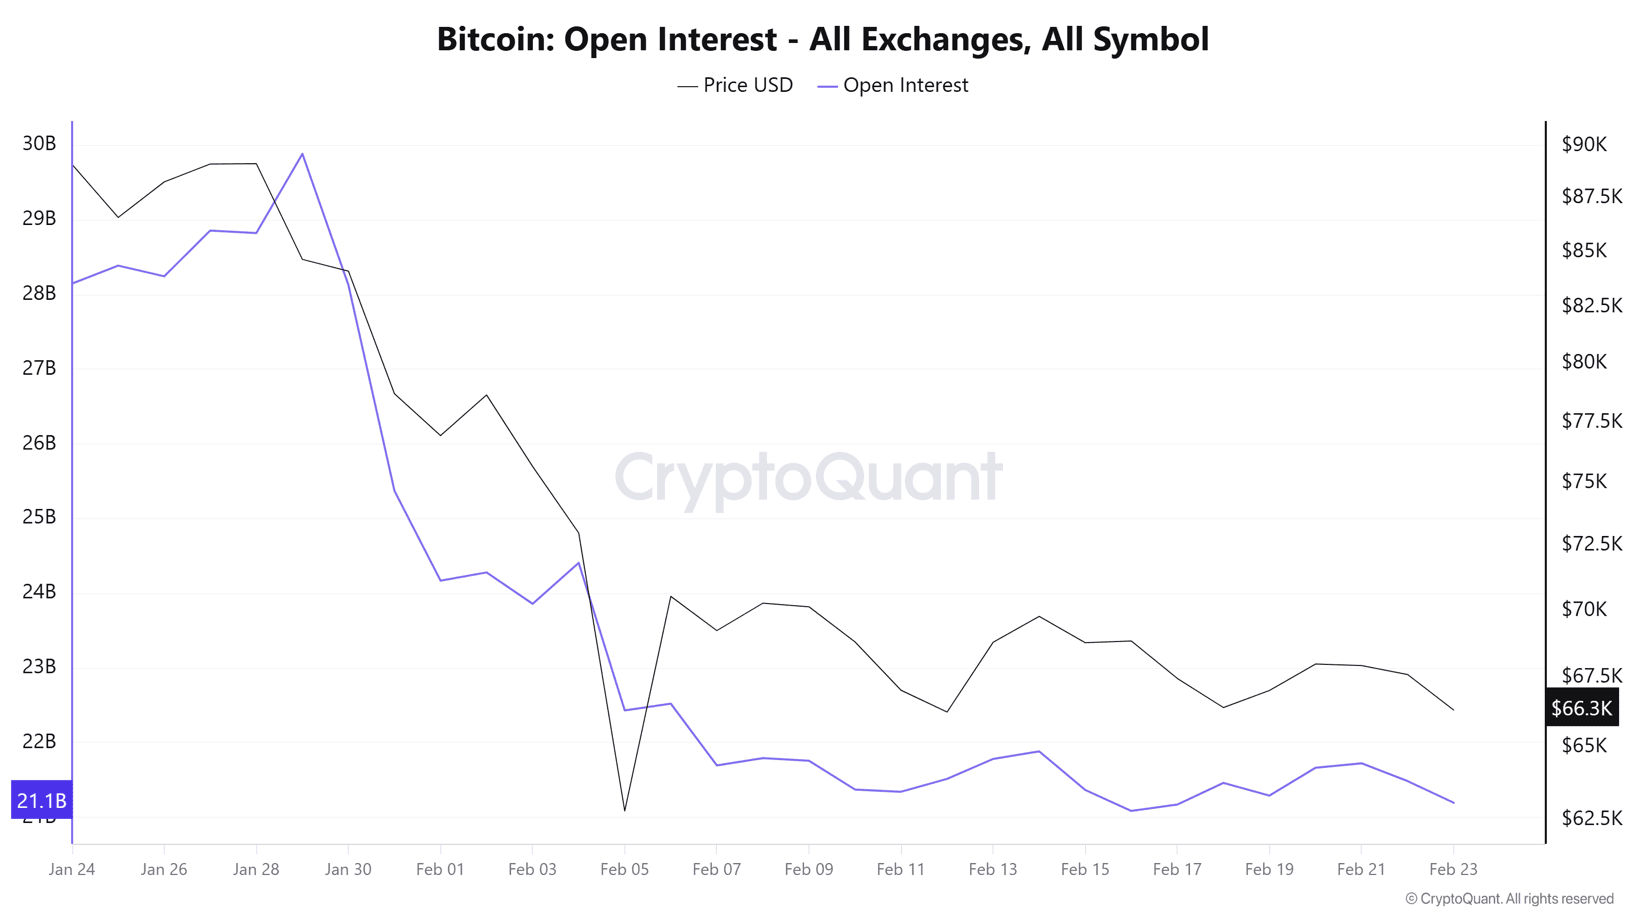
Capital outflows from the Bitcoin market are already beginning to show in the institutional segment. The Open Interest indicator, which measures the total number of outstanding positions in the market, has shown another short-term decline, falling toward the $21.3 billion area, moving away from the recent $21.7 billion high and even further from the nearly $29 billion levels observed in January.
This behavior, together with the price decline toward the $65,000 area, suggests that the drop in the indicator is mainly due to the closing of long positions, reflecting a reduction in institutional confidence and demand in an environment of heightened global uncertainty.
Source: Cryptoquant
Taken together, these factors confirm an environment dominated by capital outflows and liquidations, associated with renewed economic tensions that have reinforced a consistent selling bias in Bitcoin’s price action. If tariff uncertainty persists, it could continue fueling a scenario of distrust and downward pressure in the coming sessions.
Confidence Returns to Critical Territory
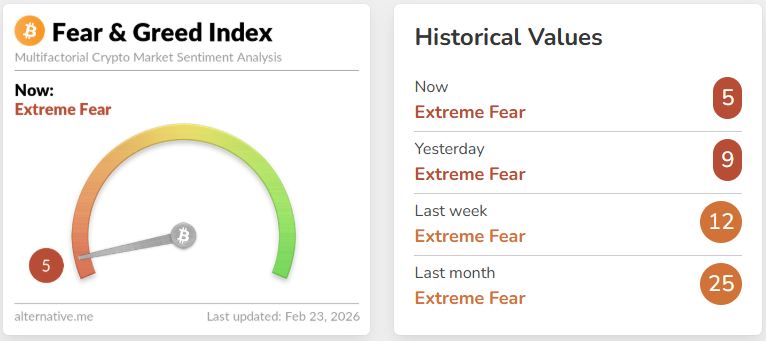
The potential escalation of trade tensions has once again impacted crypto market confidence indicators. The Fear and Greed Index remain around 5 points, in “extreme fear” territory, failing to exit this zone in recent weeks.
Source: Altermative
As long as sentiment indicators remain at such depressed levels, it will be difficult to sustain a consistent recovery scenario. This environment not only delays potential rebounds but also reinforces a structural selling bias that could continue dominating BTC’s short-term behavior.
Bitcoin Technical Outlook
Source: StoneX, Tradingview
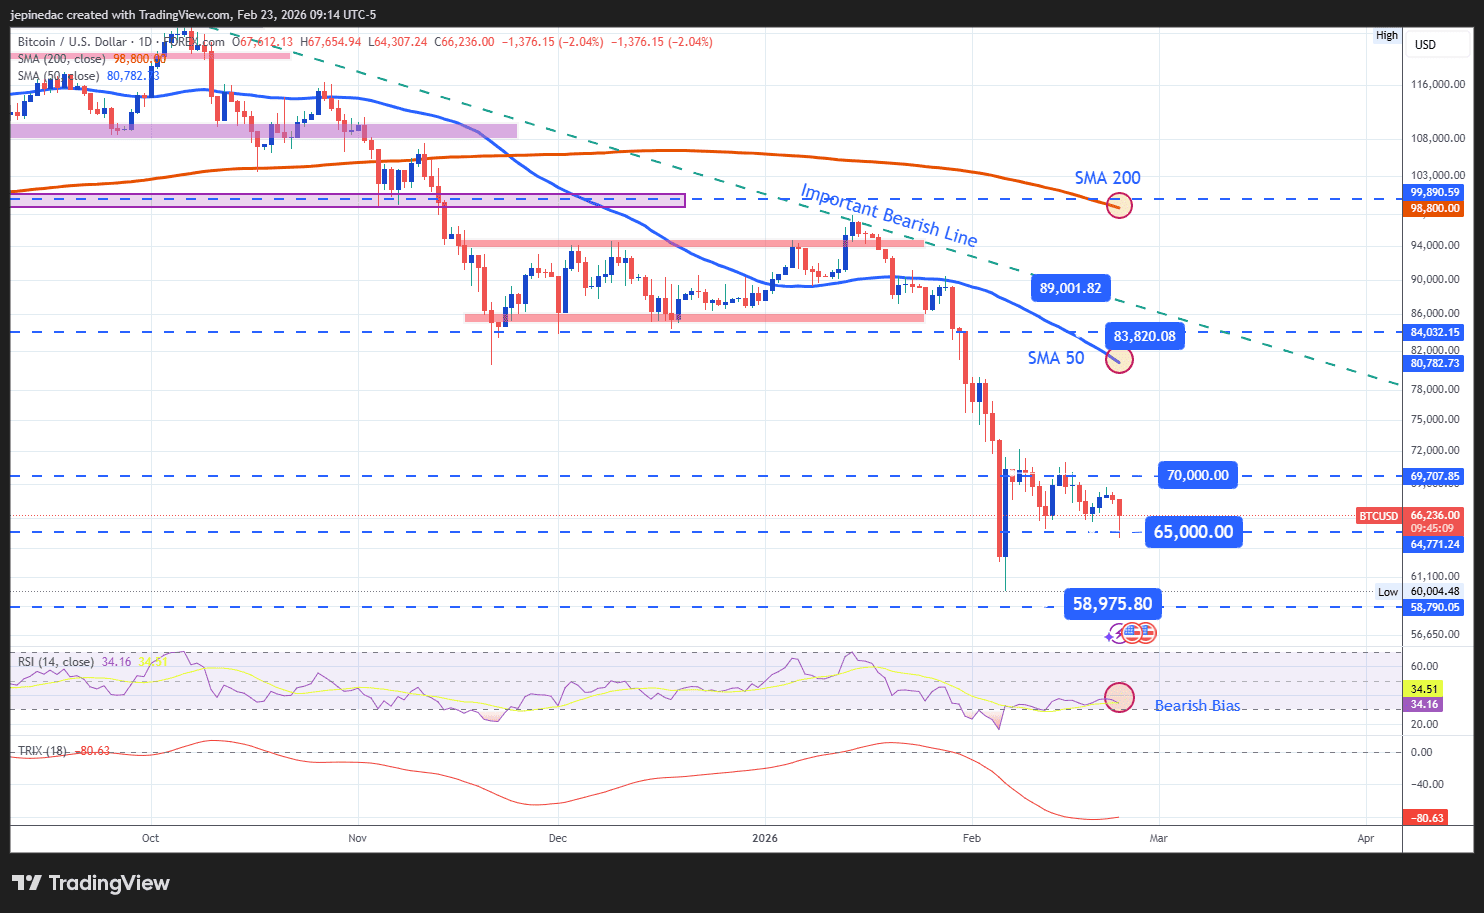
- Nothing is stopping the bearish trend: Bitcoin maintains a long-standing downtrend line in place since October 2025. Recent movements have not been strong enough to undermine the relevance of this technical structure, which continues to be the dominant pattern on the chart. The recent weakness has allowed the descending trendline to remain intact. If selling pressure consolidates, new short-term lows could form, reinforcing the validity of the bearish trend in the coming sessions.
- RSI: The RSI continues to fluctuate below the neutral 50 level, indicating that the average momentum of the last 14 sessions remains in selling territory. As long as the indicator maintains this dynamic, downward pressure could remain dominant in the short term.
- TRIX: The TRIX indicator line stands at levels even lower than those observed in December 2025, confirming that the dominant bias in the average of the exponential moving averages remains bearish. This reinforces the negative technical structure in the medium term.
Key Levels:
- 70,000 – Near-term resistance: Area of recent highs acting as the main barrier against potential bullish corrections. Sustained moves above this level could reactivate a more relevant buying bias.
- 65,000 – Near-term barrier: Important level that has consolidated as the most relevant bearish resistance during recent trading sessions. Price movements that consistently break above this level could end the neutrality observed in recent weeks and could give way to more significant selling pressure, potentially targeting the early February lows.
- 58,000 – Major support: Area corresponding to the October 2024 lows, representing the most relevant bearish barrier at this stage. A sustained break below this level could open the door to a more aggressive extension of the downtrend, leading to greater dominance of selling pressure in the short term.
Written by Julian Pineda, CFA, CMT – Market Analyst
Follow him on: @julianpineda25