
Bitcoin continues to struggle to stabilize, maintaining a broad bearish bias in the short term. Over the last five trading sessions, the cryptocurrency has posted four consecutive losing days, accumulating a drop of more than 9%, reinforcing sustained selling pressure and a clear decline in market confidence. For now, bearish momentum remains firm as demand for Bitcoin weakens, and if this sentiment persists, price weakness could continue to dominate movements in the sessions ahead.

BTC Sees Increasingly Aggressive Selling
The global macroeconomic landscape is not at its strongest heading into year-end. Major central banks, such as the European Central Bank (ECB), have opted to keep interest rates unchanged, and the U.S. Federal Reserve (Fed) may join that stance, having yet to confirm whether it will continue its rate-cutting cycle during the final part of the year.
This high-rate environment with no short-term prospects for cuts has dampened risk appetite, as the higher cost of borrowing could reduce both consumption and investment across major economies. This effect has been particularly evident in the cryptocurrency market, where Bitcoin has failed to sustain consistent demand in recent trading sessions.
In fact, Bitcoin ETF data reflects this declining institutional interest. As of November 14, there were capital outflows totaling nearly $500 million, marking three consecutive sessions of negative flows. This confirms that institutional participation has weakened notably, reducing demand for the asset and sustaining short-term selling pressure.
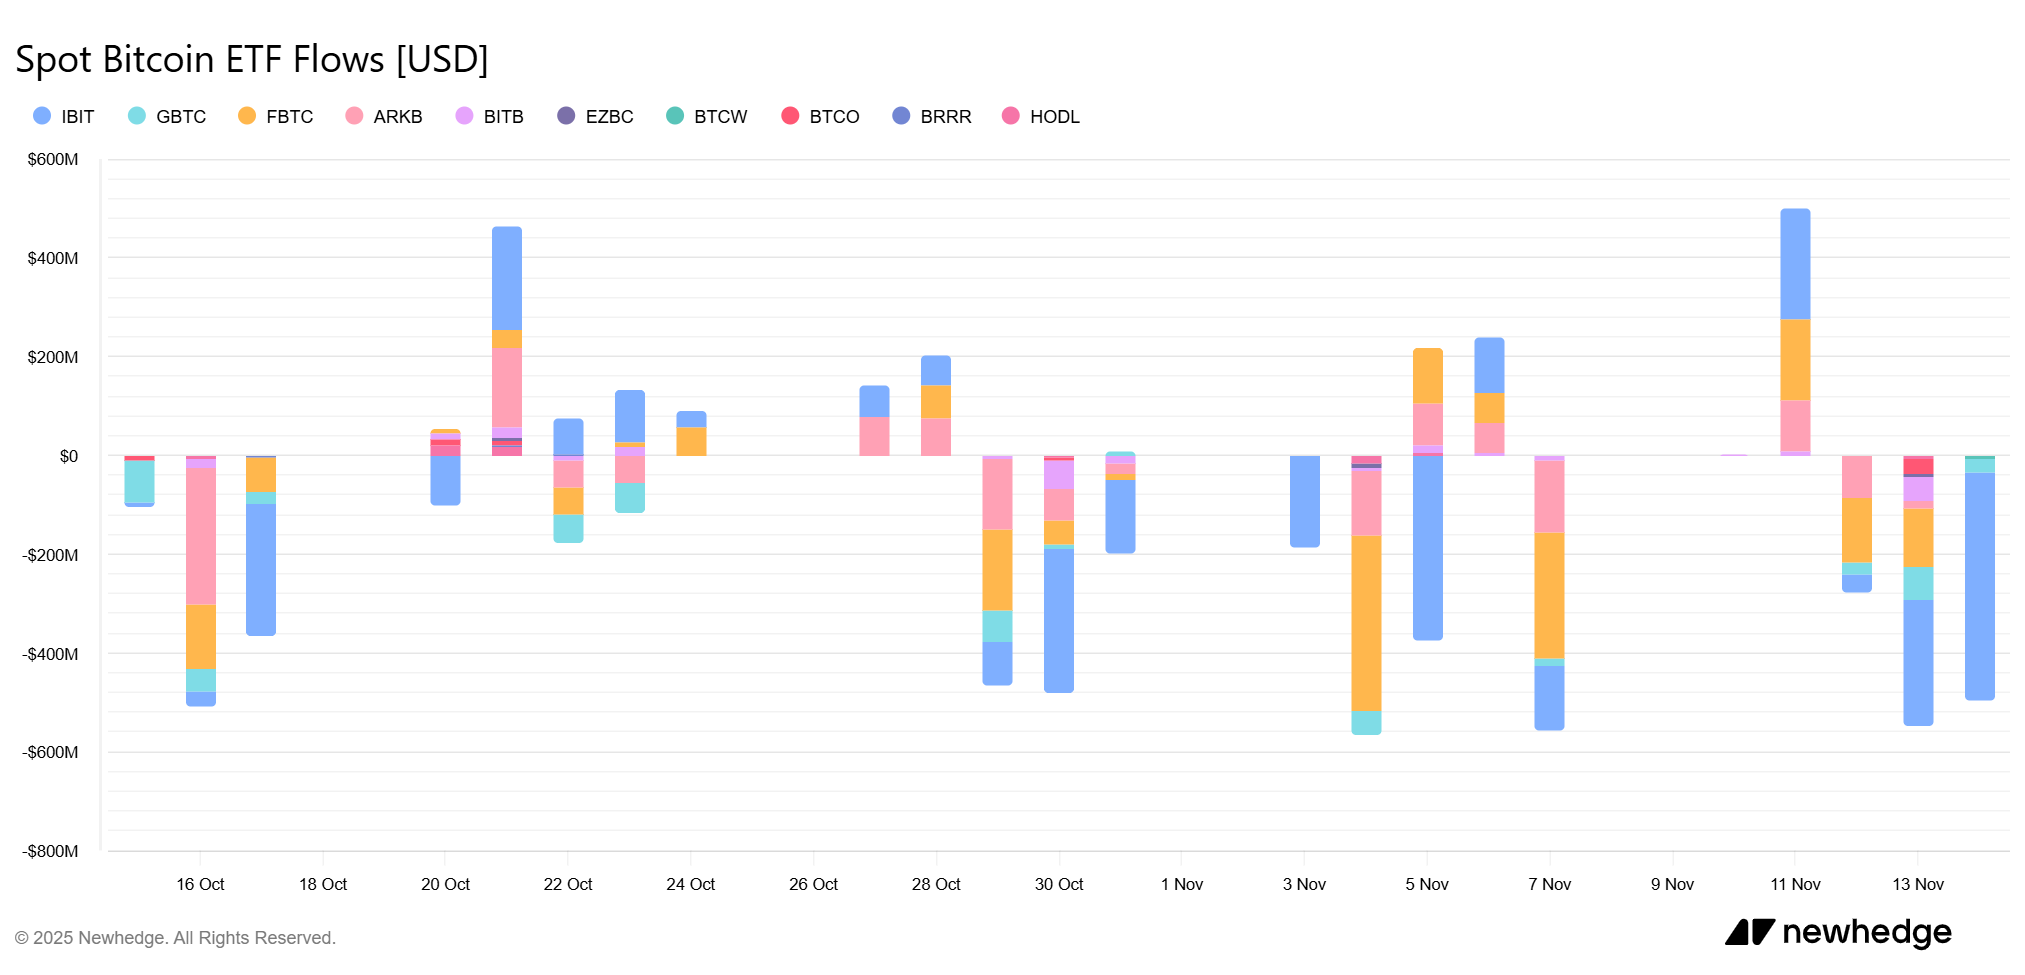
Source: newhedge
At the same time, the Open Interest indicator for the Bitcoin market continues to fall, marking several consecutive weeks of declines and currently standing around $32.3 billion—one of the sharpest downward streaks of 2025. Open Interest measures the total number of open long or short positions, and its decline alongside price confirms a steady exit of long positions, suggesting a lack of investor appetite or ongoing profit-taking activity, which has led to a fragmented and weak demand in recent weeks.
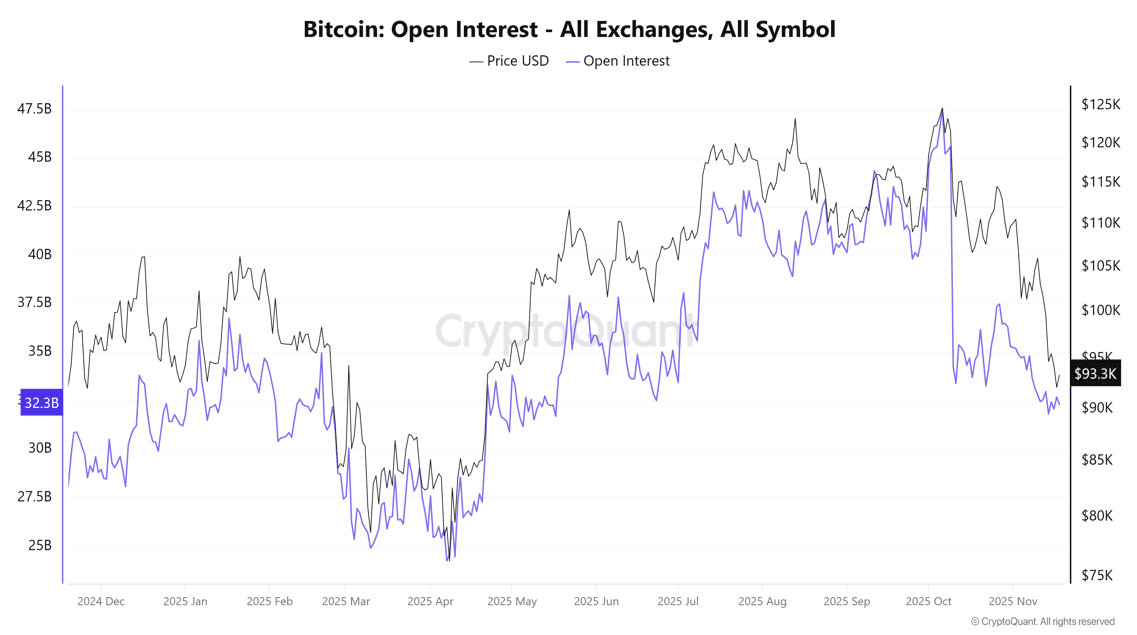
Source: Cryptoquant
In this context, Bitcoin faces a notable loss of appeal, as the current macroeconomic conditions do not favor demand for risk assets. If capital outflows persist in the short term, the market may continue to show a lack of confidence compared to traditional financial instruments, maintaining stronger selling pressure over the next few sessions.
Technical Outlook for Bitcoin
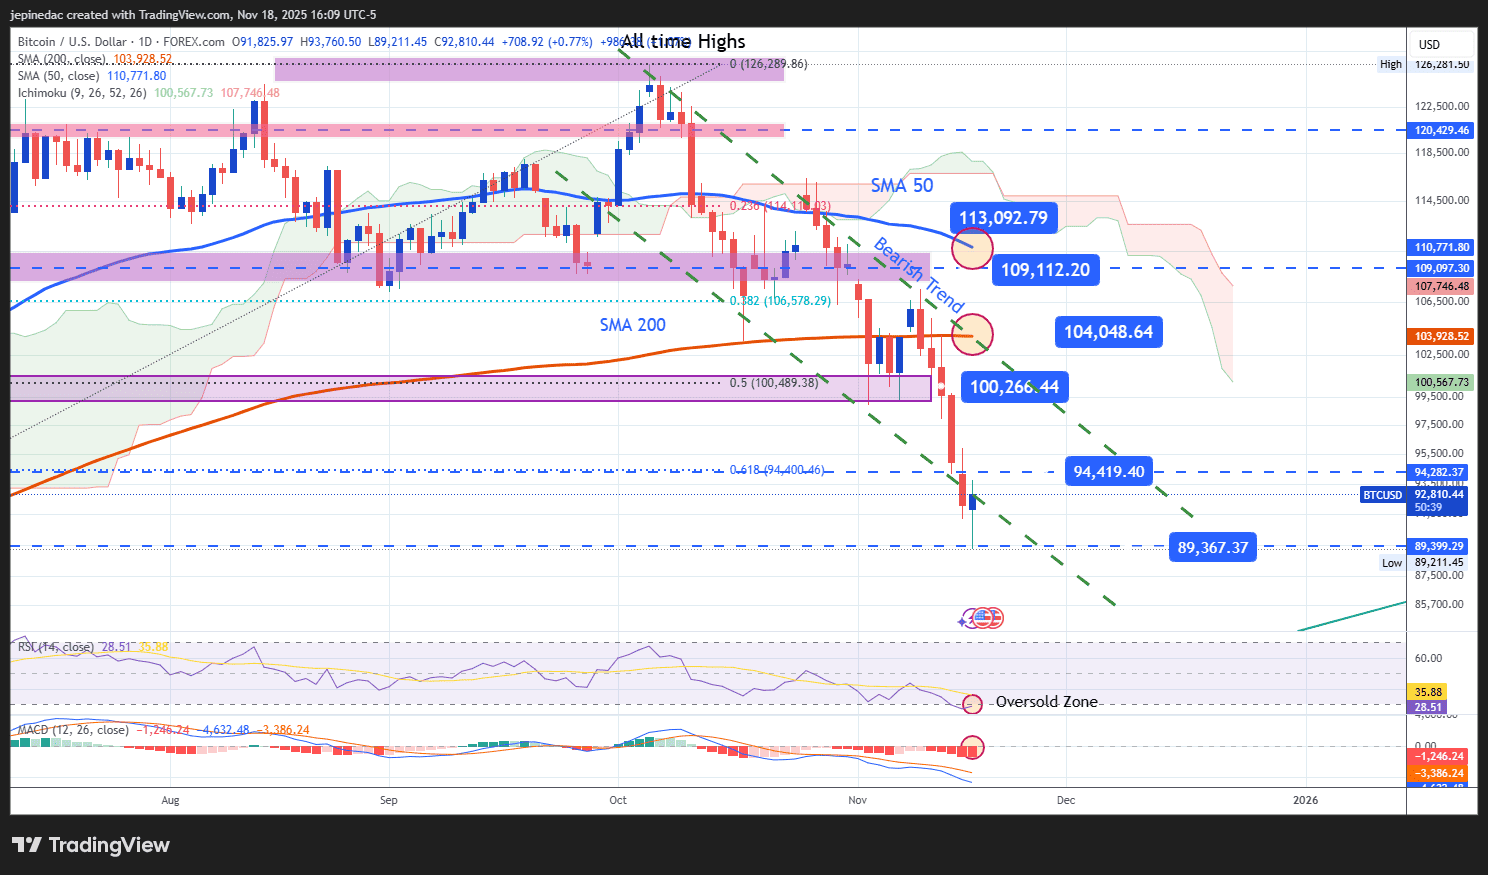
Source: StoneX, Tradingview
- Downward Channel Remains Intact: Recent BTC price action has pushed the cryptocurrency to levels not seen since early 2025, reflecting a clearly bearish pattern. No significant bullish corrections have appeared to threaten the formation of the descending channel, which continues to be the dominant technical structure in the short term. As long as the price remains below the 200-period moving average, the channel is likely to continue guiding price movements in the sessions ahead.
- RSI: The RSI line remains below the neutral 50 level, confirming that selling momentum continues to dominate over the past 14 sessions. However, the indicator has fallen into the oversold area (around 30), suggesting excessive bearish pressure that could allow for technical rebounds or short-term corrections.
- MACD: The MACD histogram remains below the zero line, indicating that short-term moving averages continue to reflect bearish strength. As long as the histogram stays away from the neutral area, selling pressure is likely to remain dominant in short-term price action.
Key Levels to Watch:
- $100,266 – Major Resistance: A key psychological level within the BTC market, this area has served as an important retracement point in recent weeks. A sustained move toward this level could trigger a bullish bias and challenge the existing bearish structure.
- $94,400 – Nearby Barrier: A neutral zone not seen since May of this year, which could act as a temporary consolidation area or the start of a short-term rebound.
- $89,300 – Key Support: Represents the most recent low, below the psychological threshold of $90,000 per BTC. A break below this level could accelerate the downtrend, leading to a more aggressive bearish phase in the short term.
Written by Julian Pineda, CFA, CMT – Market Analyst
Follow him on: @julianpineda25