
Bitcoin has started the week with a notable bearish bias, accumulating a decline of more than 4% in recent sessions and pushing the price back toward the November lows. For now, strong selling pressure has persisted amid capital outflows ahead of the year-end season and due to the lack of a clear recovery in short-term confidence within the BTC ecosystem. If this dynamic continues, selling pressure may keep dominating Bitcoin’s price action over the next sessions.

Is BTC Appetite Fading?
The recent Federal Reserve rate cut has not been enough to boost Bitcoin demand. The market remains cautious ahead of this week’s NFP report and the upcoming European Central Bank decision, two events that will be key for shaping the end of the 2025 economic outlook.
Initially, lower interest rates in the United States were expected to strengthen confidence in BTC, as reduced rates lower borrowing costs and increase liquidity for risk assets. However, the Fed did not project a consistent decline in rates heading into early 2026—partly due to the need to observe the evolution of employment—and the confidence boost from recent cuts has been directed primarily toward the equity market, not toward crypto.
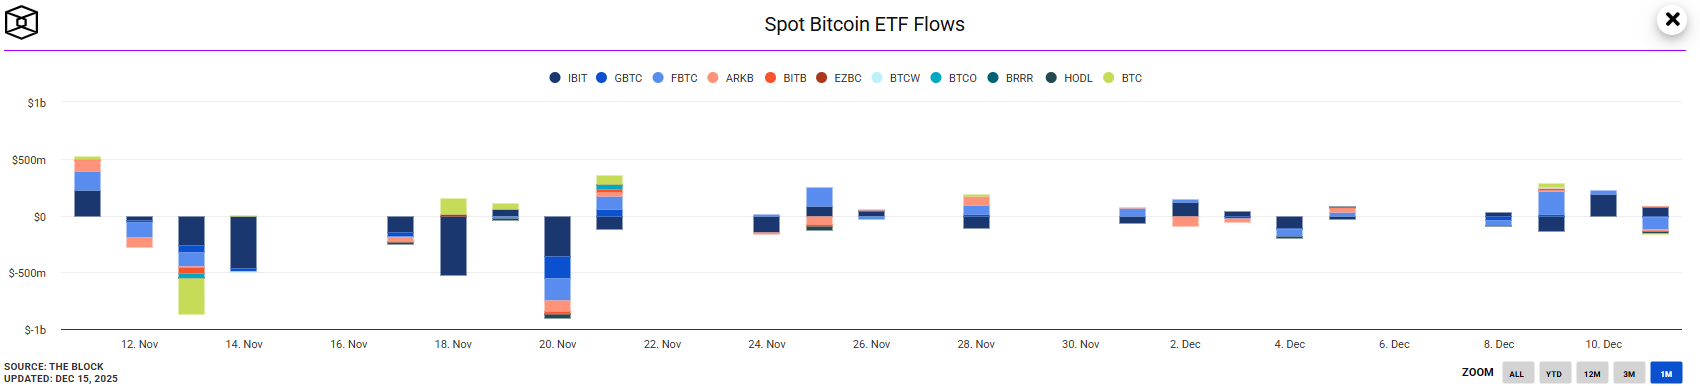
Bitcoin also has not managed to maintain steady interest, something reflected in the capital flows within ETF futures, which have once again shown notable outflows. As of December 11, net flows recorded a negative value of –162 million dollars, accompanied by a consistent drop in net capital flow over the past week. This indicates that institutional investors are not increasing demand for BTC, or in a more negative scenario, are reducing their exposure, reflecting a decline in institutional confidence.
Source: Theblock
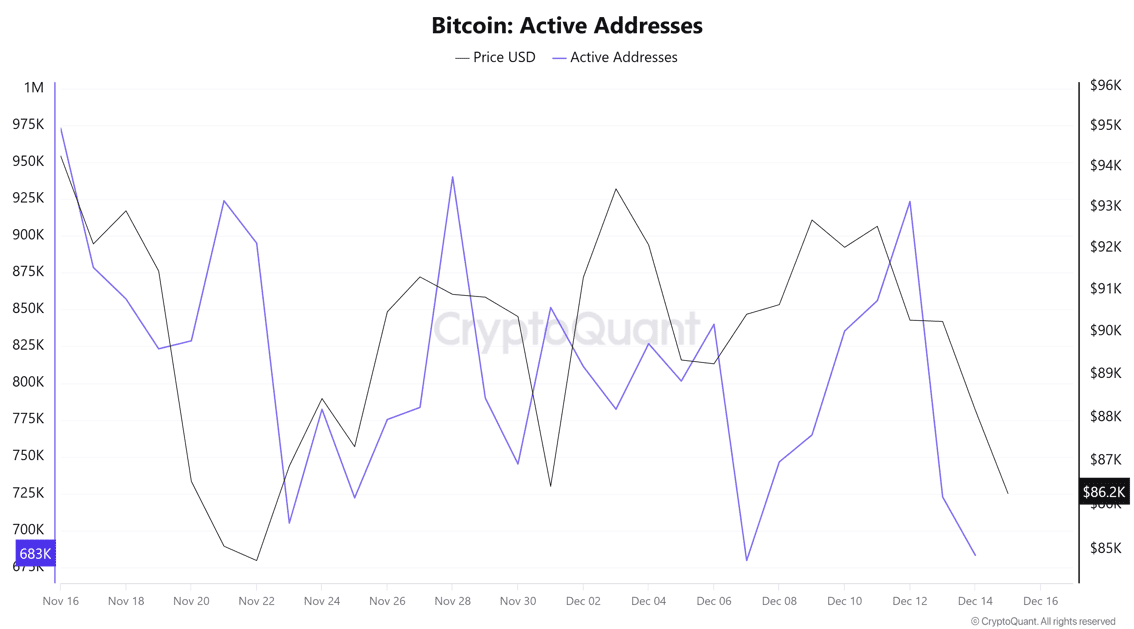
The retail environment shows a similar trend. The Active Addresses indicator, which measures activity within the BTC network, reveals a sharp drop: from more than 900,000 active addresses on December 12, the figure has fallen to 683,000, a significant decline in user activity. This may reflect short-term market distrust or a natural reduction in activity toward year-end. In either case, it shows that consistent retail demand has been difficult to sustain in recent sessions.
Source: Cryptoquant
Given all the above, the absence of a clearer global economic backdrop may be limiting appetite for BTC. As the year-end approaches, low activity may open the door to a phase of indecision, potentially accompanied by continued liquidations. If indicators fail to show improvement in demand or network participation, the current selling pressure may remain relevant in the sessions ahead.
Confidence Struggles to Recover
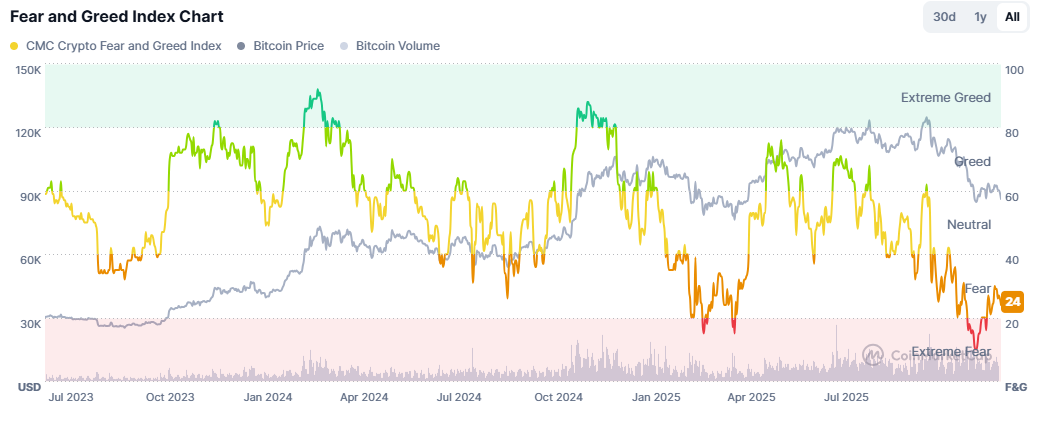
Crypto market sentiment continues to show a bias toward indecision, reflected in the behavior of the Crypto Fear & Greed Index, which remains at 24 points, within the fear category and near extreme fear. This suggests that, despite Bitcoin’s partial recovery in recent weeks, pessimism still dominates the short-term outlook.
Source: Coinmarketcap
This persistent uncertainty and pessimism indicate weak BTC demand. Without a relevant catalyst to revive confidence, weakness could persist, especially if the index continues to show negative oscillations. Over time, this scenario may support sustained bearish pressure on BTC in upcoming sessions.
Bitcoin Technical Outlook
Source: StoneX, Tradingview
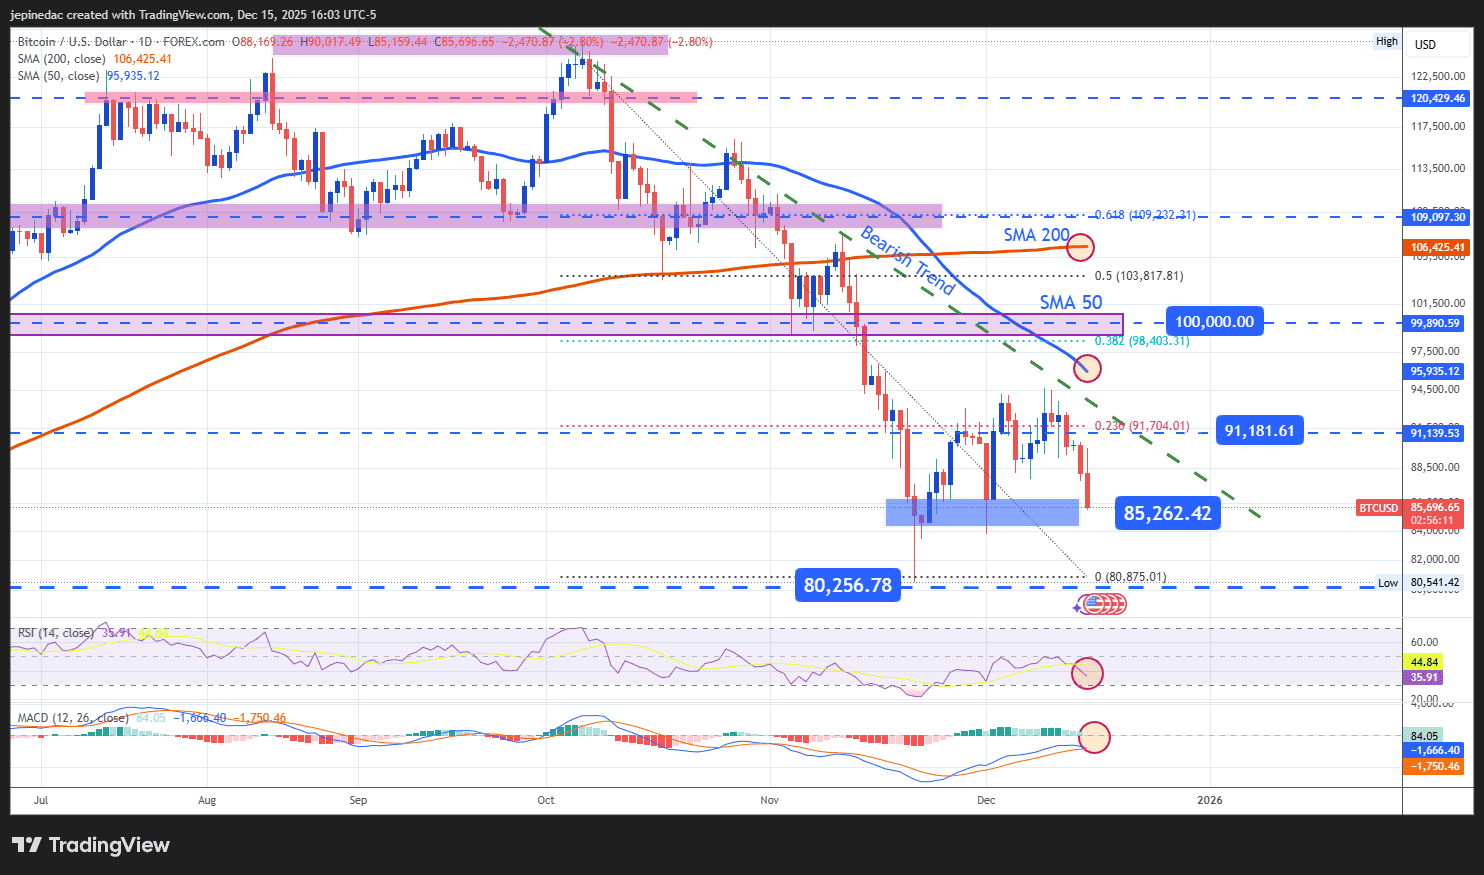
- Downtrend Dominates: Although Bitcoin recently attempted to recover above 90,000 dollars, the selling bias resumed and pushed price action back to the lowest levels seen since November. This reinforces the validity of the downward trendline, active since the all-time highs. As long as selling pressure continues, price may mark new lows, especially if no meaningful bullish impulses appear in the short term.
- RSI: The RSI slope has turned negative again and remains below the neutral 50 level, showing that selling impulses dominate the past 14 sessions. If this behavior persists, even stronger bearish pressure could emerge in the next few sessions.
- MACD: The MACD histogram has begun declining once again below the zero line, signaling that the average strength of short-term moving averages favors the bearish side. As long as the histogram stays below neutral, greater selling pressure could consolidate in the short term.
Key Levels:
- 100,000 – Key Resistance: The main bullish barrier, aligned with a retracement observed in June and the downward trendline of recent weeks, as well as the 38.2% Fibonacci level. If BTC breaks above this area, the broader downtrend could be considered finished, activating a dominant bullish bias.
- 91,181 – Nearby Barrier: A near-term support aligned with the 23.6% Fibonacci retracement, representing a relevant neutrality zone. If price returns to this region with limited strength, an indecision range may form amid the lack of bullish or bearish dominance.
- 85,262 – Final Support: The lowest level within the downtrend. A break below this support would confirm a dominant bearish bias and extend the trendline that remains the most important technical factor guiding BTC movement into the next sessions.
Written by Julian Pineda, CFA, CMT – Market Analyst
Follow him at: @julianpineda25