


- Bitcoin outlook takes a boost as stocks continue upsurge while dollar dips
- Higher lows suggest selling pressure is fading
- Key breakout level sits near $74-$75K with upside targets at $80K and beyond
The Bitcoin outlook is starting to look more constructive as the market stabilizes following weeks of broader financial volatility. Despite surging prices of crude oil, and turbulence in equity and FX markets, Bitcoin has held relatively firm since the US-Isreal-Iran war started at the end of February. The cryptocurrency fell here and there, but essentially held its own rather well, forming a base with a sequence of higher lows. That’s often an early sign that downside momentum is fading. More recent price action suggests a more decisive bullish breakout may now be on the cards.
Risk appetite improves, dollar extends drop
Over the weekend, those US-Iran talks in Islamabad falling apart only provided Bitcoin, Ether and global indices with short-lived pressure. As Monday wore on, oil prices slipped again—and the dollar went with them. That, in turn, alleviated pressure on BTC and ETH, resulting in further dip-buying. Market seems to be taking the view that, while the Strait of Hormuz blockade looks like an escalation on the face of it, it might actually force Iran back to the table given the economic hit from lost oil exports. Trump’s remark that Iran had reached out to restart negotiations only added fuel to the move, prompting another round of dollar selling, and crypto buying.
The S&P 500 has returned to pre-war levels, which is a positive development for other risk assets like Bitcoin:
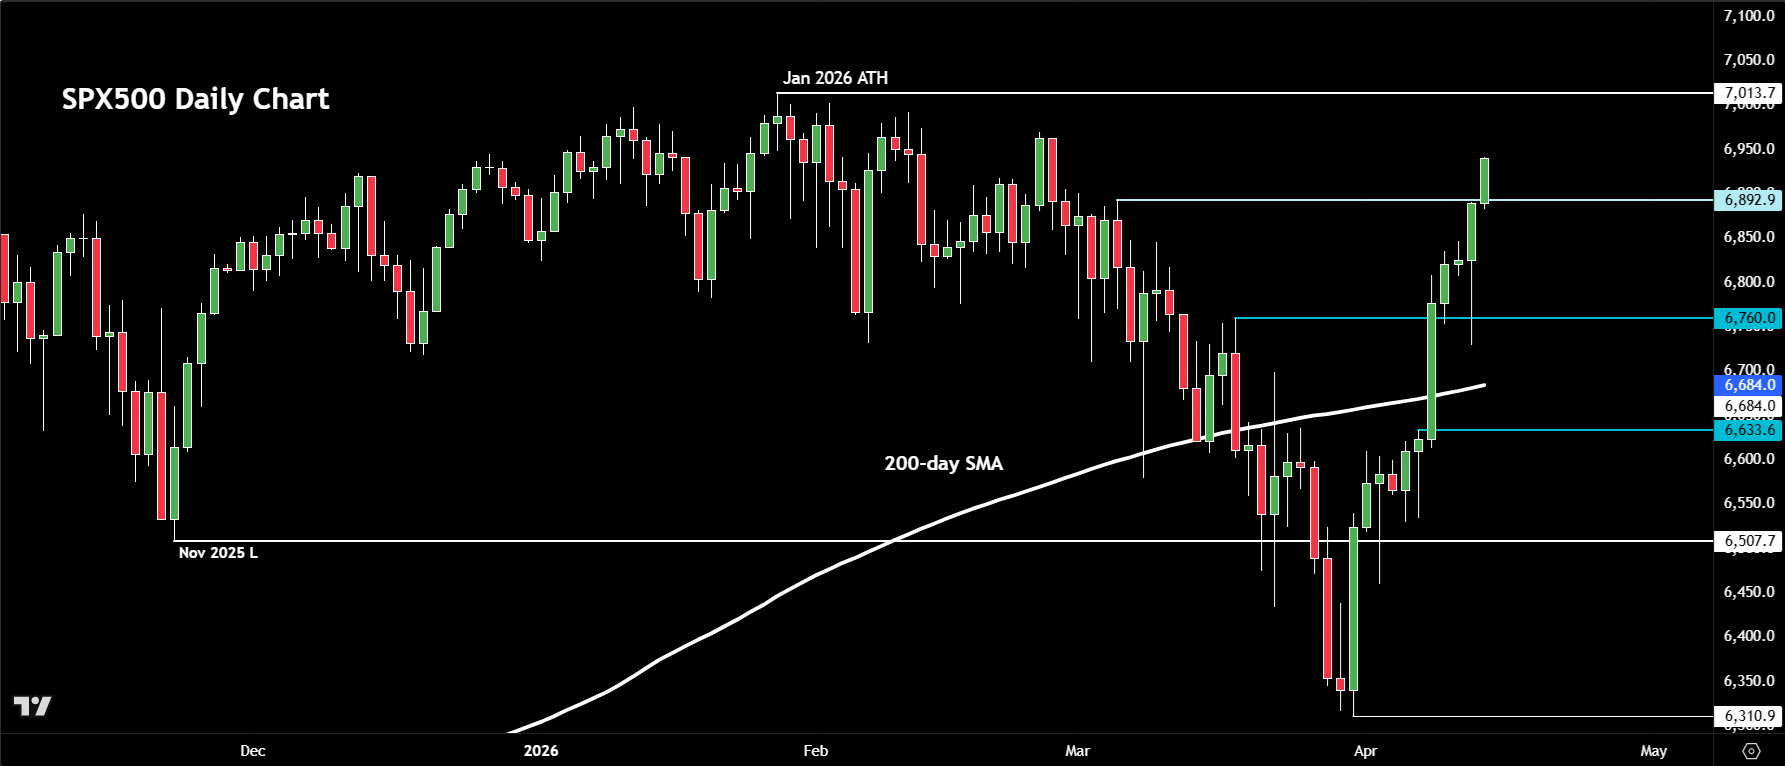
While many analysts are leaning towards a fairly calm, glass-half-full interpretation of events, the catch, of course, is that a lot of the good news now looks to be priced in – certainly for major indices and the dollar. That does leave the door open for a bit of a dollar rebound if tensions pick up again. But for Bitcoin, it may not matter too much given that the selling had actually started well before the war started. In fact, Bitcoin started to fall from October, before the pace of the selling gathered pace in the ensuing months. So, much of the selling in Bitcoin may well be behind us now.
Technical Bitcoin outlook: Charts hint at a bottom
From a higher timeframe perspective, the technical picture is particularly interesting.
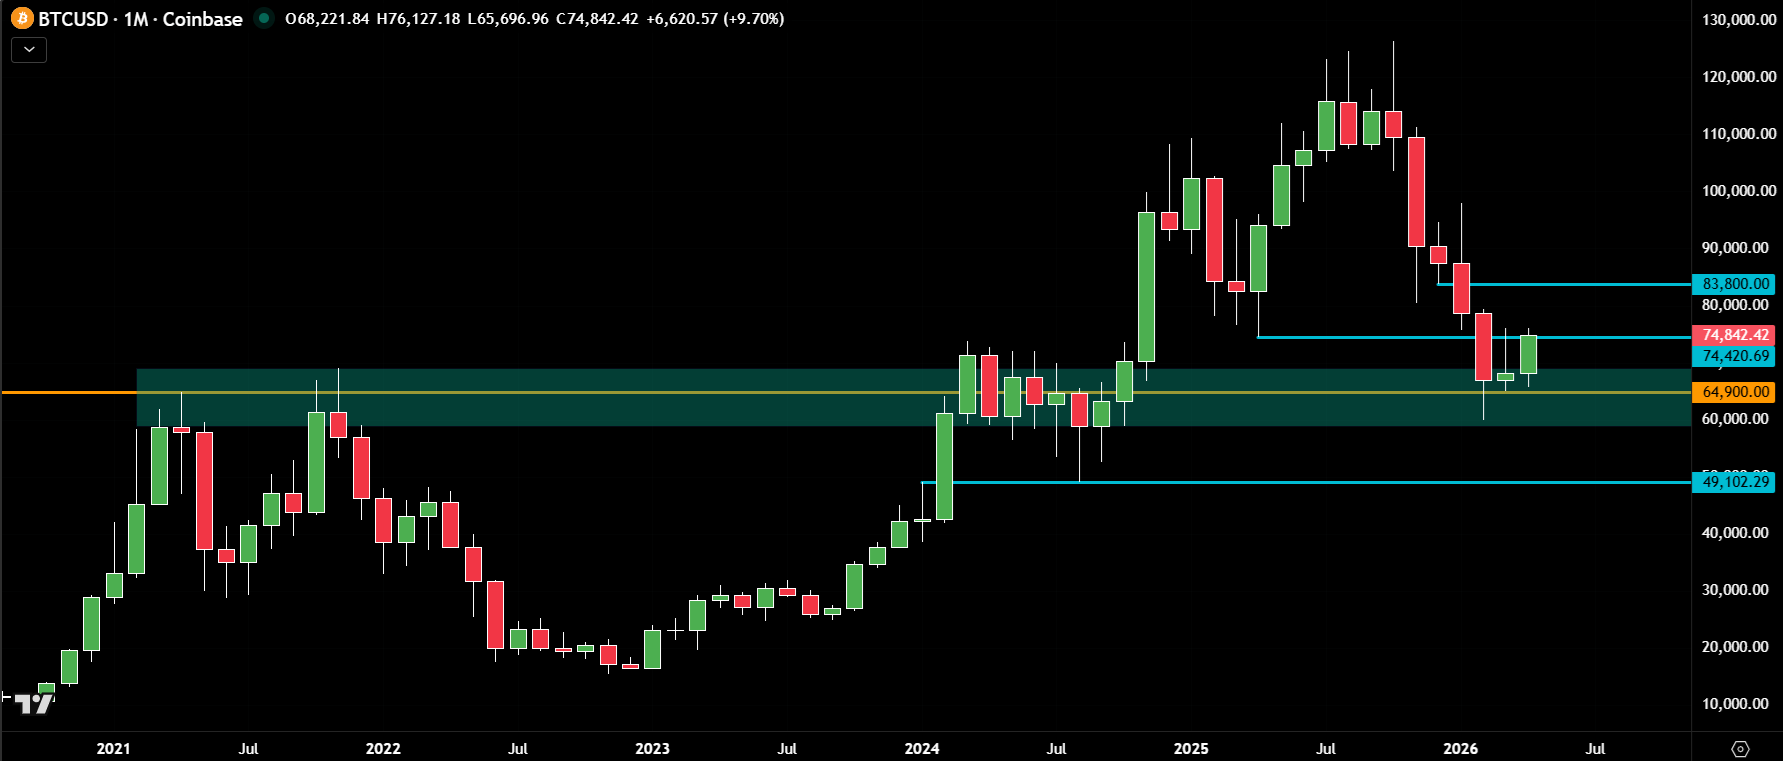
On the monthly time frame, the Bitcoin chart has been testing a major support zone around $65,000 over the past couple of months. This level previously acted as resistance in 2021, later contributing to a double top and subsequent sell-off. More recently, it served as the base for a breakout in Q4 2024, making it a critical level for the long-term bullish trend. So far, buyers appear to be defending this area, with March showing a small green candle and April showing some upside follow-through. These are early signs of a brighter Bitcoin outlook as the suggest potential recovery after a five-month decline ended in March.
Bitcoin key levels to watch
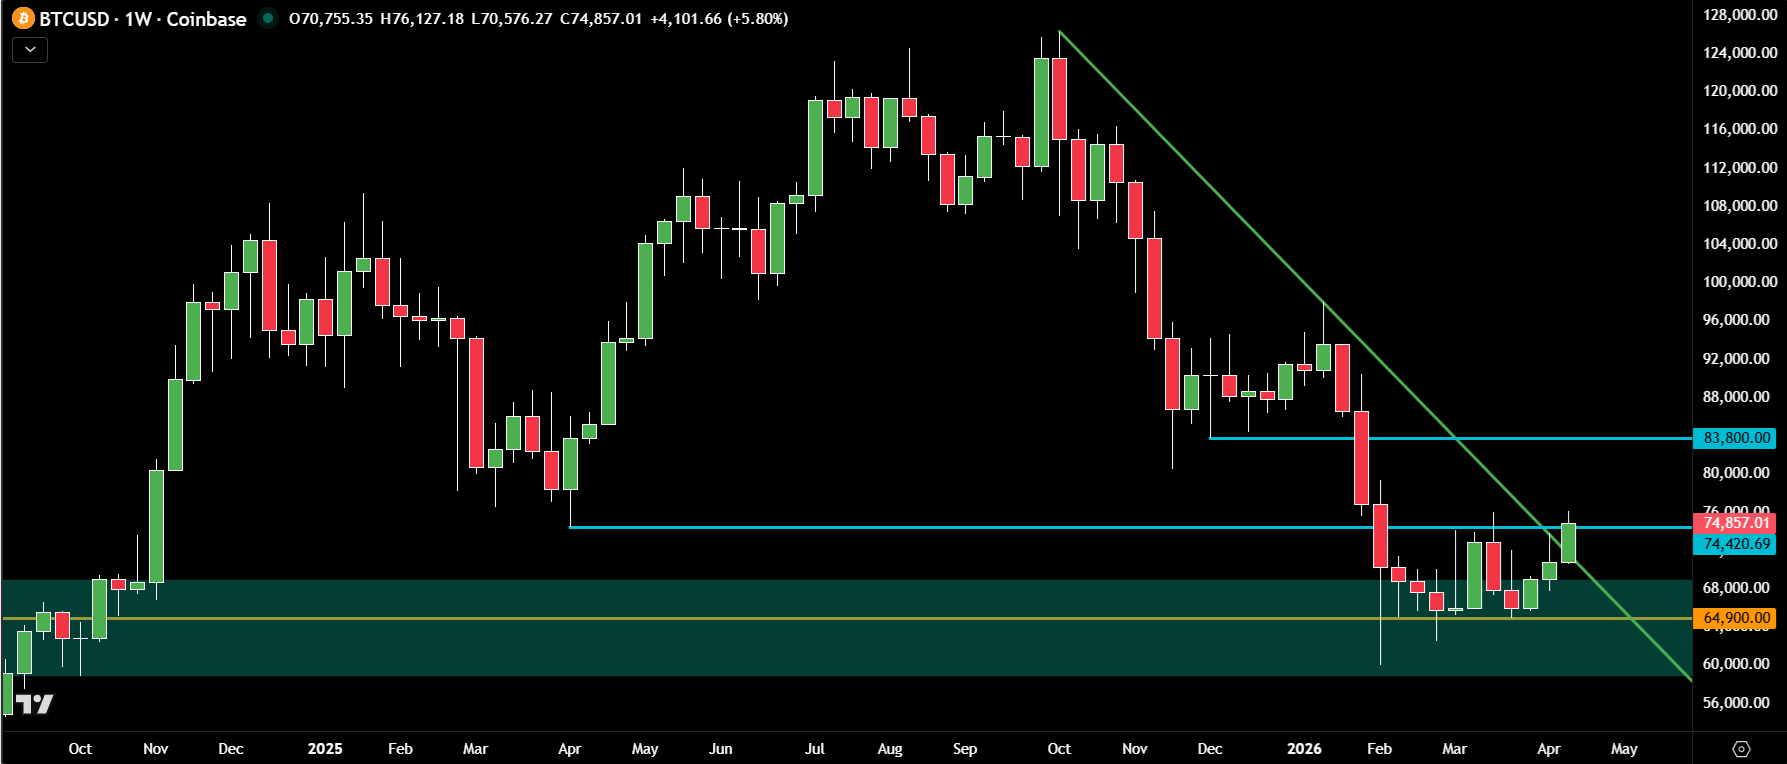
Bitcoin on the weekly chart highlights a key trendline resistance around $73.5K to $74.0K being taken out. Price is currently holding above this level, and a confirmed breakout could signal the next leg higher. Notably, a former support zone from April 2025 is also being challenged again, increasing the importance of this region.
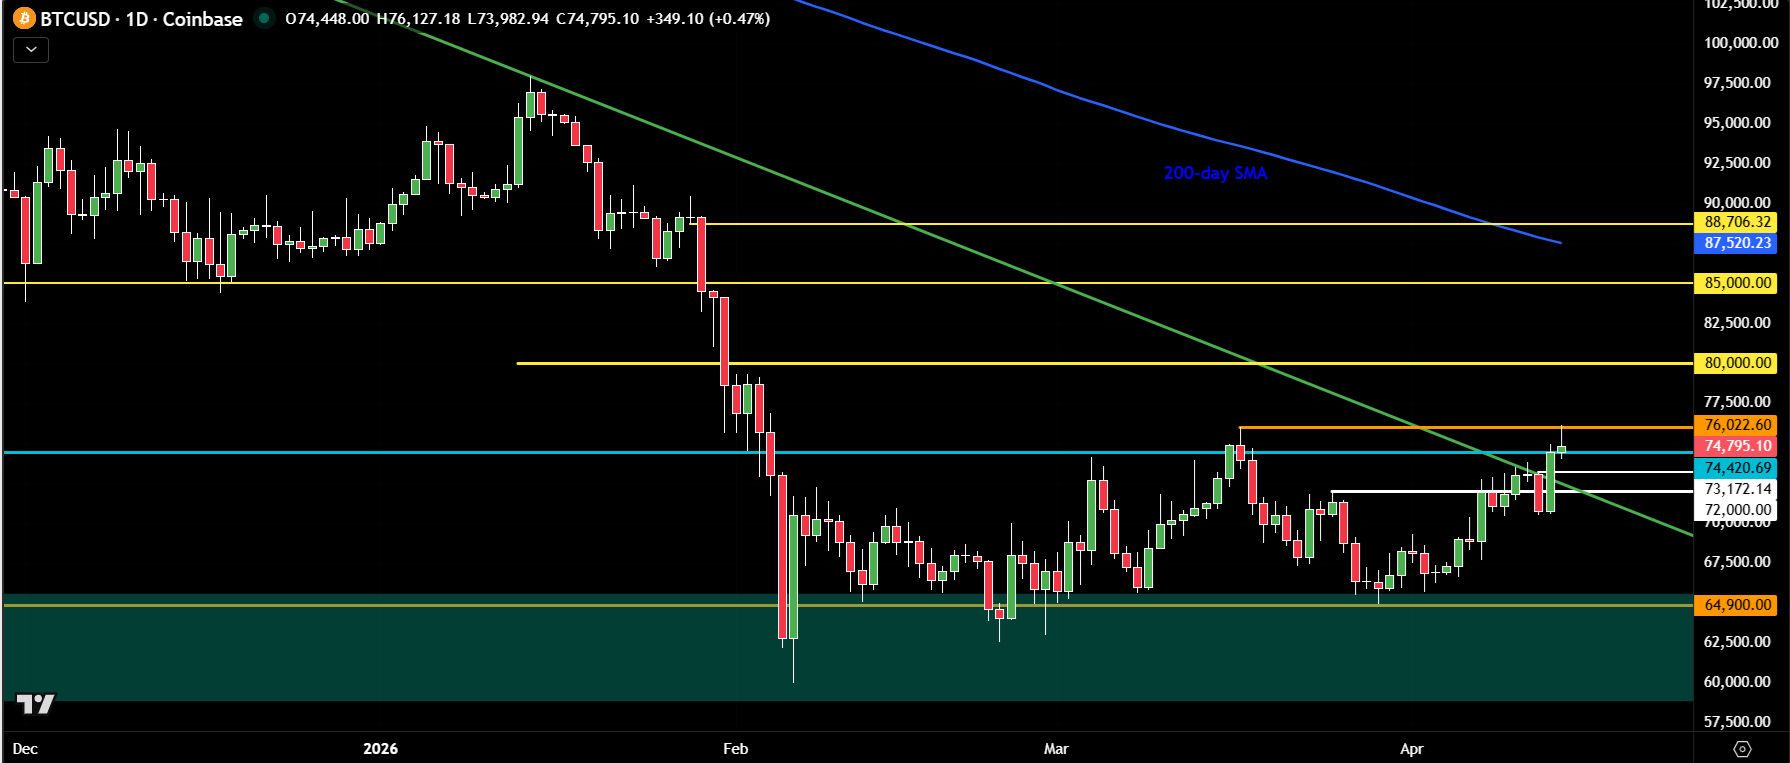
On the daily timeframe, short-term price action has turned more bullish with price now holding above the rising 21-day exponential moving average, which is an objective indication that the short-term trend has indeed turned positive. Bitcoin also recently swept a prior low around $65,600 but refused to hold there or break below $65,000. Instead, it recovered fairly quickly, then consolidated for a few days, before pushing higher again. This is a sign that the sellers are now getting trapped and suggests a possible short-term bottom is already in place.
Looking ahead, if Bitcoin can now hold its own above $73,500 to $74,000 area, the next upside targets come in at $80,000, followed by $88,500 and then $87,500, where the 200-day simple average converges. Beyond these levels, another psychological level of $90,000 will be in view next.
In terms of support levels to watch, the top side of the broken resistance trend and old horizontal resistance around $73,000 area is now key. The bullish Bitcoin outlook now hinges on whether the bulls can defends this area to help secure a decisive breakout.

-- Written by Fawad Razaqzada, Market Analyst
Follow Fawad on Twitter @Trader_F_R




