
- Blue wave at US midterms compounds existing AI investment concerns
- Japanese AI beneficiaries hammered before Wednesday's sell-off
- Nikkei rebounds strongly from 60,000 support zone
- Bullish RSI divergence warns bears against complacency
The Nikkei 225 bore the brunt of selling pressure early in Wednesday's Asian session, with existing concerns about stretched AI valuations, the enormous sums being invested in the technology and the eventual returns they will deliver compounded by a blue wave, and a sizeable one at that, in the US midterm elections.
With Democrats taking control of both chambers of Congress and President Donald Trump signalling his willingness to accept the results and work with his political opponents, the scale of the Republican defeat clearly spooked traders early in the session, introducing another potential headwind for the AI investment boom, especially in states leading the AI data centre buildout, such as Texas, which has flipped to the Democrats.
With significant upstream exposure to semiconductor manufacturers and companies supplying the picks and shovels behind the AI capex boom, the implications for the Nikkei are clear to see, pointing to the potential need to temper exuberant expectations about prospective revenue and earnings growth.
Source: LSEG
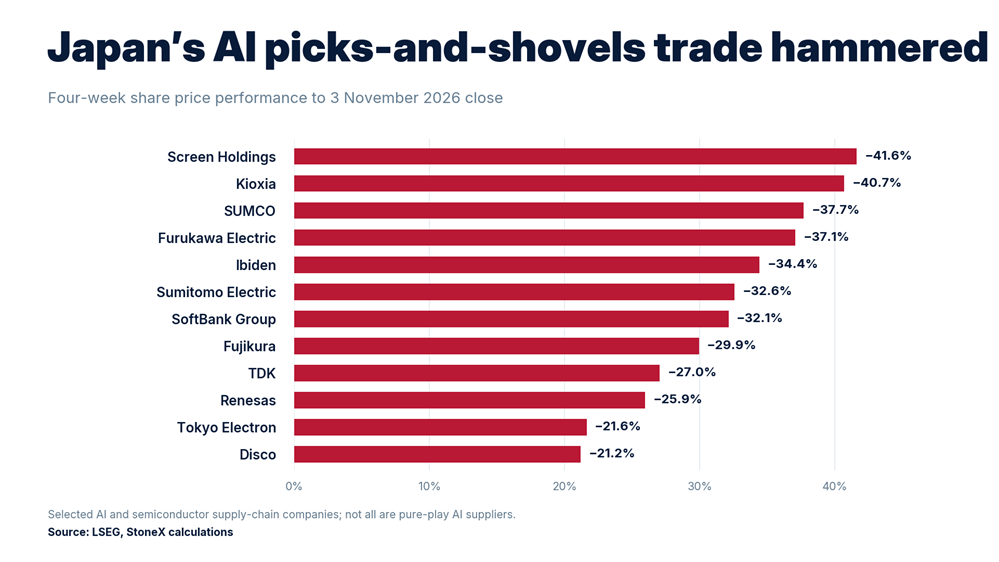
However, many Japanese companies linked to the AI trade have already fallen a very long way, as seen in the graphic above. With that recalibration already reflected in share prices, the question now is whether the latest political developments will lead to another significant leg lower beyond that already seen, or whether the risk was effectively priced in beforehand.
AI beneficiaries already under the pump
As the graphic above shows, some of the market darlings that ran extremely hard earlier this year, such as Screen Holdings and Kioxia, had fallen more than 40% over the preceding four weeks before Wednesday's unwind. SUMCO, Furukawa Electric, Ibiden and SoftBank Group had also shed more than 30% over the same period.
While all are linked in one form or another to the AI capex buildout, the scale of the losses was not confined to semiconductor manufacturers themselves, but extended to companies supplying memory, advanced substrates, fibre optics and electrical infrastructure.
Source: LSEG
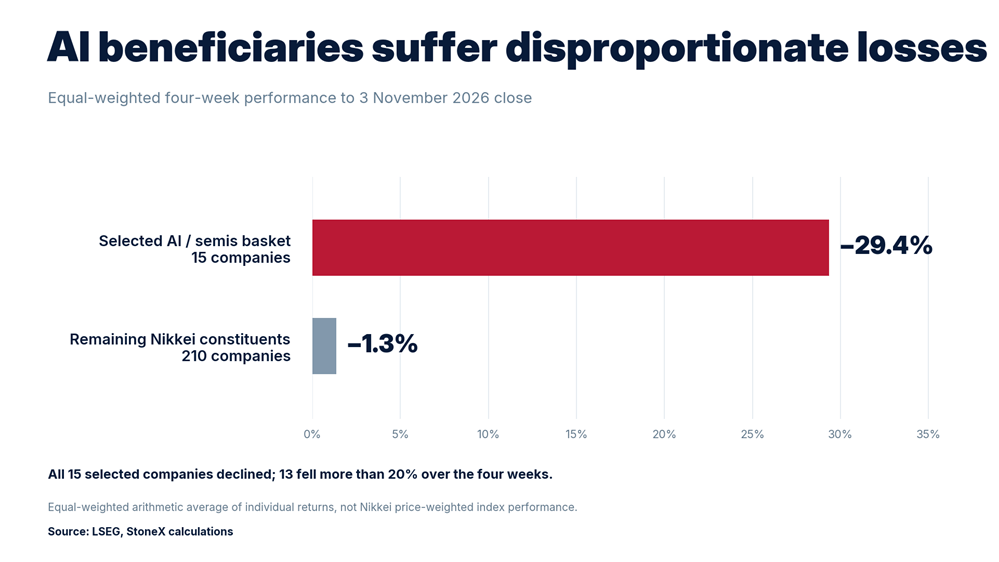
Once these companies are stripped out of the broader Nikkei, it's clear that the recent drawdown has been borne disproportionately by AI favourites. A basket of 15 selected AI-related companies fell an average of 29.4% over the preceding four weeks, dwarfing the equal-weighted 1.3% decline for the remaining 210 Nikkei constituents, according to our calculations using LSEG data.
The selling has been concentrated across the AI complex, dragging the broader Nikkei lower, given the sheer size of these names in what is a price-weighted index.
Nikkei 225: Can the recovery extend?
Source: TradingView
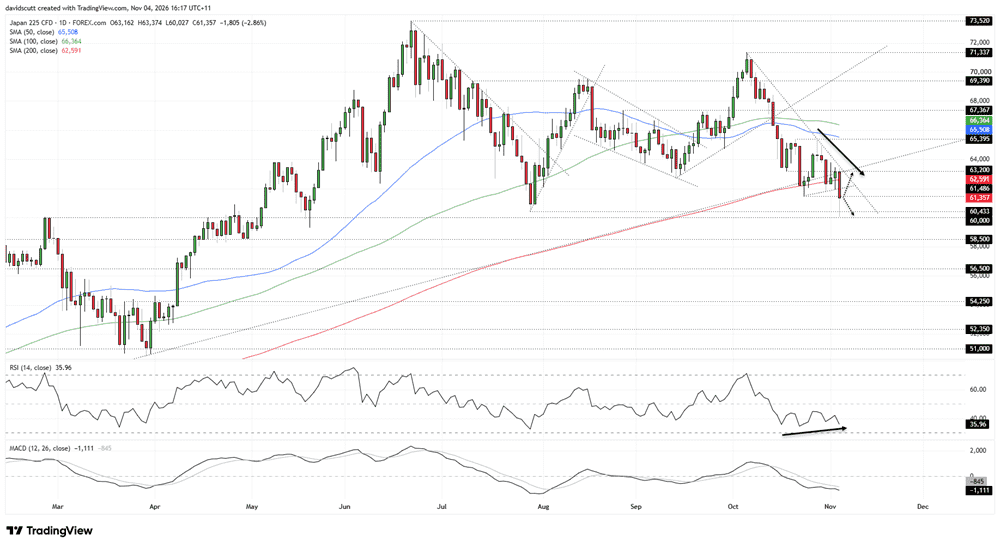
Looking at our Nikkei 225 contract, the price has bounced strongly after testing 60,000 earlier today, the lower end of a broader support zone that also comprises the July 29 swing low of 60,433. That now becomes the immediate focal point on the downside.
Overhead, the price has returned towards the breakdown point at 61,486, making that a key level to watch when assessing near-term directional risks for the index.
While the price set a fresh intraday low earlier today, RSI (14) has yet to breach the low recorded on October 22, pointing to potential bullish divergence and raising questions about the longevity of the current bearish trend, at least in the near term. While RSI (14) remains at a level consistent with sustained downside pressure, a message reinforced by MACD, the divergence creates another point of caution for bears after what's already been a pronounced sell-off.
If the index can reclaim 61,486, the levels to watch overhead are the 200-day moving average, along with the intersection of downtrend resistance and former uptrend support dating back to the Liberation Day lows set in April last year, with horizontal resistance at 63,200.
Together, they form a resistance zone that traders should be monitoring should this bounce extend into the European and US sessions.
Alternatively, if the price fails to reclaim 61,486, traders could consider initiating shorts with a tight stop above for protection, targeting a retest of the 60,433–60,000 support zone.