


British Pound, GBP/USD Talking Points:
- It’s been a fast turn in GBP/USD from last week’s lows at 1.3145, with the pair stretching that rally after this morning’s rate cut announcement from the Bank of England.
- GBP/USD bulls now face the key test as price is re-approaching a big area at the 1.3500 handle. The pair is currently working on its fifth consecutive green day and there’s now shorter-term bullish structure for buyers to work with.
- GBP/USD has been a focal point for USD-weakness in webinars of late, and you’re welcome to join the next one. Click here to register.

Fundamentals aren’t a perfect push point for price and this morning is yet another illustration of that. The Bank of England cut rates for the fifth time this year and GBP/USD has put in a bullish breakout on the back of that announcement. Perhaps more important than the fundamental drivers themselves are positioning, sentiment and expectations, and with a cut widely expected already the fact that the vote was so close illustrates a divide at the bank that brings question to future moves.
But that’s not the only factor of importance for GBP/USD, at the moment, as last week saw a hard sell-off suddenly catch at support before a reversal played in, and that’s now continued for a fifth day following support at the 1.3145 level. I had looked at this setup in the Tuesday webinar, sharing that this was one of my preferred venues for USD-weakness, given that bounce from support as taken from prior resistance to go along with a balancing of shorter-term higher-lows above the 1.3207-1.3234 area. As opined then, the setup had resemblance to the setup in mid-July which led to a rally back-above the 1.3500 level.
But 1.3500 remains a big way point and buyers haven’t yet been able to show much for continuation beyond that price since the flare in early-Q3. That line in the sand is fast approaching.
GBP/USD Daily Chart
Chart prepared by James Stanley; data derived from Tradingview
GBP/USD Shorter-Term
From the four-hour chart we can see that recent grind-higher taking on the form of an ascending triangle formation. The next resistance zone that I had looked at in the Tuesday webinar was the same support from mid-July, spanning from 1.3395-1.3414. That zone is already in-play and buyers are trying to stretch past it as of this writing. I’d be cautious of trying to chase the move at this point given how quickly the breakout has come on, but there’s now support potential for shorter-term strategies in that same zone, or a little lower, at the 1.3365-1.3370 zone. Below that, 1.3333 sticks out and if bears break back-below that, it’s going to start looking like a failed breakout for bulls.
Sitting overhead, there’s a swing of prior support at 1.3462 before the 1.3500 zone, which is then followed by 1.3593-1.3617.
GBP/USD Four-Hour Price Chart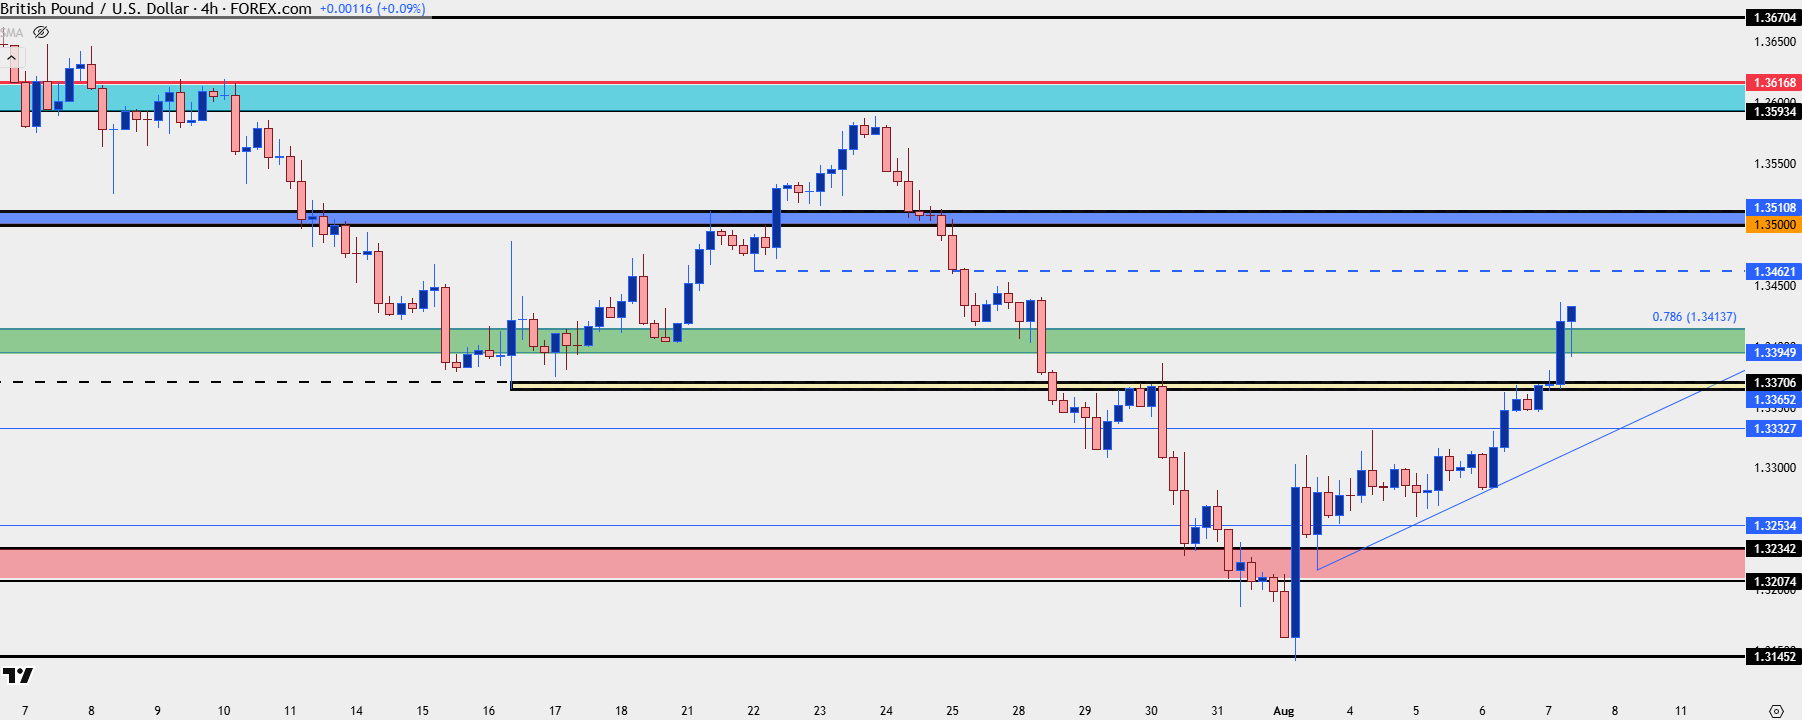
Chart prepared by James Stanley; data derived from Tradingview
--- written by James Stanley, Senior Strategist



