


Canadian Dollar, USD/CAD Talking Points:
- It’s a short squeeze as we near the weekly close in USD/CAD, as the pair has rallied on the back of social media comments from President Trump talking about tariffs on Canada.
- Earlier in the session, USD/CAD had been down by as much as 5% to mark its largest quarterly sell-off since Q1 of 2016, which was the initial failed breakout at the 1.4500 handle.
- Trump’s comment on Truth Social said ‘we are hereby terminating ALL discussions on Trade with Canada, effective immediately,’ and that sent USD/CAD jumping-higher. This remains a fluid situation and below I attempt to parse the short-term reaction from the long-term backdrop in the pair.
- Given the fluid nature of the matter traders should be cautious with exposure in USD/CAD on the weekly open, like what showed in early-February when a low liquidity backdrop led to wild swings in the pair on a Sunday night.

Earlier in the session USD/CAD had been down by a little more than 5% for Q2, marking the largest quarterly sell-off for the pair since Q1 of 2016. That’s when the current long-term range started to come into play, following the first failed breakout at the 1.4500 handle.
But matters can change quickly in modern markets particularly when President Trump is watching the matter. A comment just a few hours ahead of the weekly close sent a shockwave through USD/CAD markets and, at this point, it appears that we have a short squeeze scenario playing out, which could possibly turn into something more. Trump’s comment was pointed towards Canada, who he said is ‘a very difficult country to trade with.’ In retaliation for Canada’s Digital Services Tax on American technology companies, Trump announced that the U.S. is terminating ‘ALL discussions on Trade with Canada, effective immediately.’ (capitalization from President Trump’s social media message)
This harkens back to the first month-and-a-half of the year when Trump’s tariff threats had a bullish impact on USD/CAD, helping the pair to rally up to fresh multi-decade highs. As tensions eased, so too did the bullish run in USD/CAD; and Q2 was marked by calming in the trade backdrop with the S&P 500 lifting to fresh all-time-highs and USD dropping to three-year lows, USD/CAD was holding on to its largest quarterly sell-off in more than nine years.
But now that Trump is back on the tariff threats to Canada, there’s the prospect of change, and the immediate reaction, given the timing of the comment, looks to be a squeeze of shorts following what’s been a consistent and one-sided trend so far in Q2. This has pushed the pair up for a test of the 1.3750 level that had last held the highs on Wednesday.
USD/CAD Four-Hour Price Chart
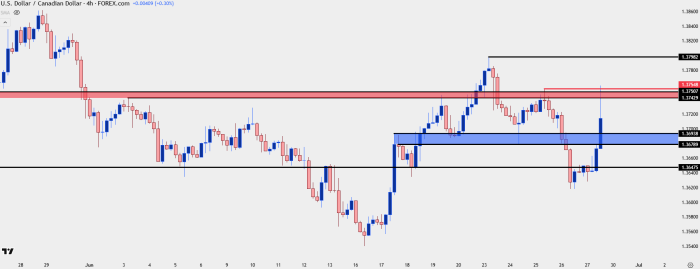
Chart prepared by James Stanley; data derived from Tradingview
USD/CAD Intermediate-Term
I’ve been highlighting the bearish trend in USD/CAD during webinars over the past few months and holding the pair as one of the more attractive venues for USD-weakness to track. The challenge especially of late is just how one-sided the trend has become, which means that positioning is likely one-sided and that makes the market prone to short-squeeze scenarios and stalled breakdowns, such as we’re seeing now.
But – short squeezes can turn into bullish trends and the ultimate question as to whether that happens is if we see bulls show support at higher-lows, reacting to a perceived ‘value’ on pullbacks from those short-term breakouts.
On the daily chart we can identify a few areas of note – with one of the more important ones currently in-play as resistance at the 1.3750 level. This was support back in May, which led to a pullback to 1.4000 before sellers went back on the attack. I looked at 1.3750 for resistance on the Tuesday webinar, which played out on Wednesday. For this bounce to become anything more than a short squeeze we’re going to need to see buyers stage a push above that level and, ideally, a show of support there as well.
For further structure, there’s follow-through resistance at 1.3798 and then 1.3889-1.3905. If bulls can force a push up to either of those areas, the argument can be made for short-term higher-highs, after which higher-lows could be sought for top-side trend continuation purposes.
Above those nearby zones, both 1.4000 and then the 1.4151-1.4178 zones loom large; and both can carry longer-term connotations that I’ll touch on below.
USD/CAD Daily Chart
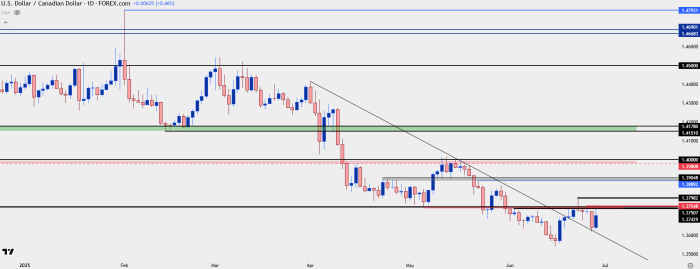
Chart prepared by James Stanley; data derived from Tradingview
USD/CAD Longer-Term
I discussed this in a video a little earlier on the day but we’re nearing the quarterly close with Monday as the final day of Q2 trade. As I showed in that video, there’s been several turns and inflections in the USD around quarterly opens and closes particularly over the past couple of years. But, with that said, there’s seemed to be a concerted effort from USD bears to continue to push, and if we do see USD breakdown scenarios hold through Q3 and the second-half of 2025, then USD/CAD can remain attractive on that front.
USD/CAD Monthly Chart
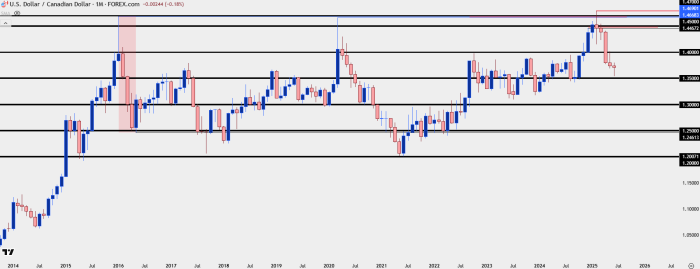
Chart prepared by James Stanley; data derived from Tradingview
The range that began nine years ago remains in-play today. Interestingly, it was after the initial failure at 1.4500 that this began back in 2016; and in the nine years since, USD/CAD has largely remained within those boundaries. This was a big part of the reason that I started looking at the short side of the pair in February, and as sellers started to show a greater and greater impact, that downside trend took on new steam in April.
The problem for bears is that in the final two months of Q2, the trend was incredibly one-sided, and that means an imbalance in positioning. That can make the pair prone to short squeeze scenarios, such as we’re seeing now, and that can also make bearish continuation a more challenging prospect as there’s simply not enough possible sellers left on the sidelines.
But – a countertrend move, such as we’re seeing now, can put more sellers on the sidelines and allow for the pair to pose a deeper pullback. From the weekly chart, this exposes the 1.4000 and 1.4151-1.4178 zones, both of which have longer-term connotations, as key spots of possible lower-high resistance for big picture, longer-term strategy in USD/CAD.
USD/CAD Weekly Chart
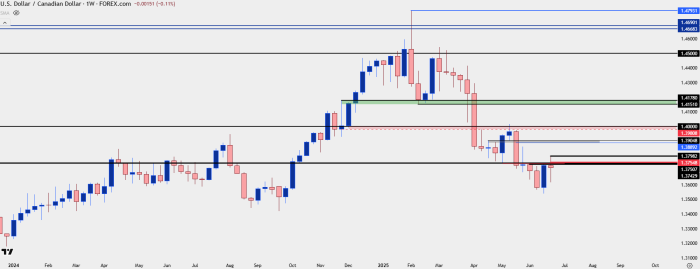
Chart prepared by James Stanley; data derived from Tradingview
--- written by James Stanley, Senior Strategist




