


Despite the fact that in the last four trading sessions the USD/CAD had registered a decline of around 0.9% in favor of the Canadian dollar, the start of the new week has seen a significant upward move, mainly due to weak GDP data in Canada, which has raised fresh concerns. As the market prices in the possibility of a slowdown in the Canadian economy in the short term, buying pressure on USD/CAD is likely to gain further relevance in the sessions ahead.

What Happened with Canada’s GDP Data?
The latest quarterly GDP report for Canada, covering the period ending June 30, showed a 1.6% slowdown, compared to the downwardly revised 2.0% growth in the first quarter. As a result, annualized growth in the first half of the year stood at just 0.4%. This contraction was mainly driven by a decline of around 7.5% in exports, impacted by recurring tariffs that have weighed on Canada’s economic activity.
These results have sparked concerns about the need for a new rate cut by the Bank of Canada to prevent the slowdown from deepening and to stabilize growth for the remainder of 2025. At present, the probability of a rate cut has risen to 48%, putting at risk the neutral stance the bank has maintained with rates at 2.75%. Moreover, if upcoming employment data in Canada, due later this week, shows weakness, the likelihood of a 0.25% rate cut at the September 17 meeting would increase, potentially lowering the rate to 2.5% for the remainder of 2025.

Source: TradingEconomics
A rate cut would not be favorable for the Canadian dollar, as it would reduce the appeal of fixed-income investments denominated in CAD, undermining demand for the currency. If economic data continues to strengthen expectations of a cut, buying pressure on USD/CAD could intensify.
What About the U.S. Dollar?
The U.S. dollar is facing its own challenges. For now, it maintains a tone of neutrality, as markets also expect a potential rate cut by the Federal Reserve at the September 17 meeting. Currently, the DXY index, which measures the dollar’s strength against a basket of currencies, is hovering around 97 points, showing little sign of recovery in the short term.
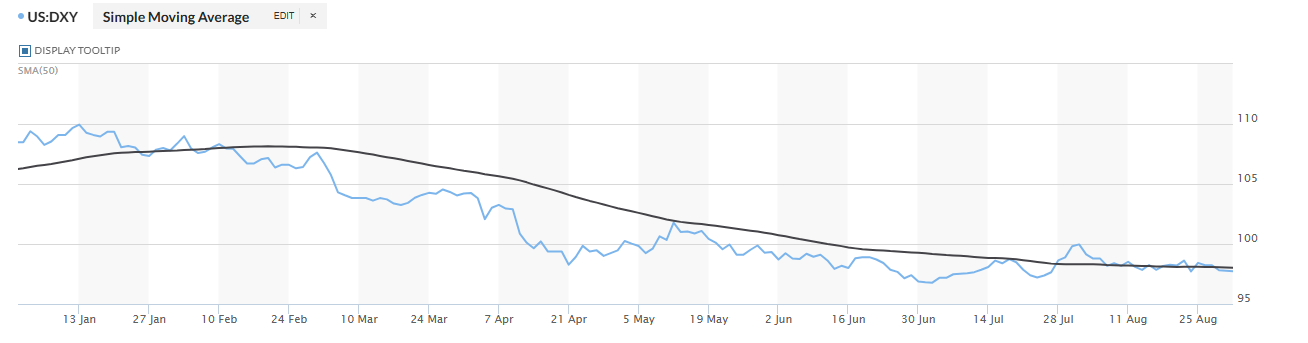
Source: MarketWatch
However, this neutrality does not imply deep weakness. If the DXY manages to recover after its prolonged decline this year, it could restore some strength to the greenback and allow it to gain ground against the Canadian dollar. In that scenario, USD/CAD could benefit from greater buying pressure in the sessions ahead, as the U.S. dollar regains some traction.
USD/CAD Technical Outlook
Source: StoneX, Tradingview
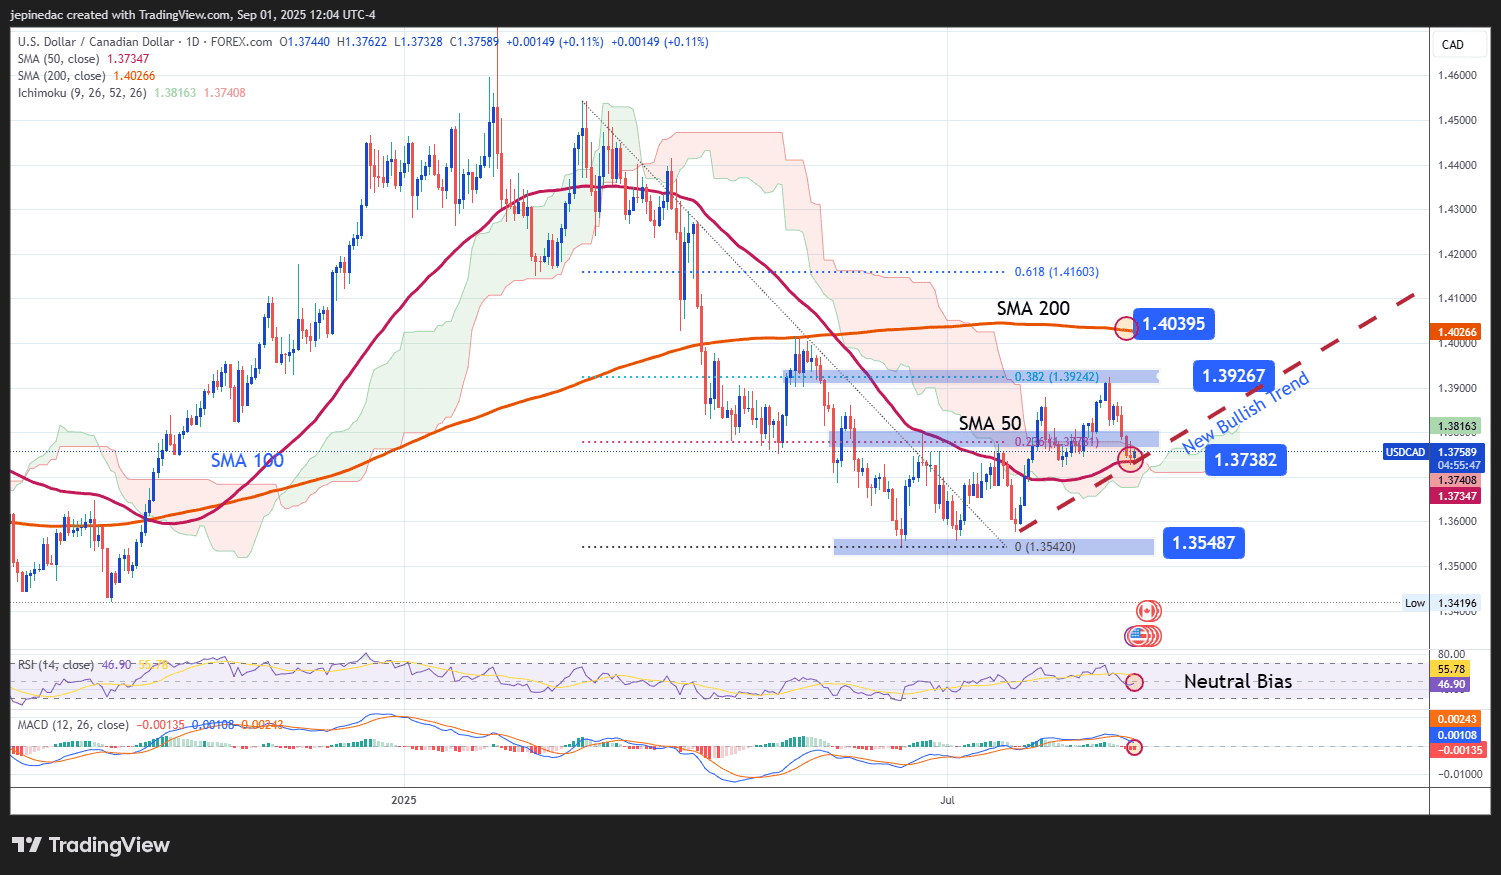
- Possible New Trend: Since July 24, the average movements of USD/CAD have shown a bullish bias, with increasingly higher lows that suggest the development of a possible uptrend in the short term. For now, recent pullbacks have not been strong enough to confirm a dominant bearish bias, leaving open the possibility of a recovery that could consolidate a more solid bullish trend.
- RSI: the RSI line remains close to the neutral 50 level, reflecting a consistent balance between buying and selling pressure over the past 14 sessions. This indicates that the market has not yet defined a clear direction. However, the slope of the RSI is tilted upwards, suggesting that if it breaks above the central 50 level, buying momentum could begin to dominate and strengthen the short-term bullish outlook.
- MACD: the histogram hovers around the 0 line, confirming the presence of neutrality in short-term moving averages. This condition could persist in the sessions ahead, keeping the pair’s movements confined within a limited range.
Key Levels:
- 1.37382 – Crucial Support: coincides with the 50-period simple moving average and the Ichimoku cloud, making it a key barrier against potential downside moves. A sustained break below this level would trigger a dominant bearish bias.
- 1.39267 – Immediate Resistance: corresponds to the 38.2% Fibonacci retracement. A rise toward this level could reactivate the bullish bias that has weakened in recent weeks.
- 1.40395 – Key Resistance: aligns with the 200-period simple moving average and stands as the most important bullish barrier. A sustained breakout here would confirm a consistent uptrend, with potential to extend over the coming weeks.
Written by Julian Pineda, CFA – Market Analyst
Follow him at: @julianpineda25




