


Over the past five trading sessions, USD/CAD has posted a decline of more than 0.7% in favor of the Canadian dollar, maintaining a consistent bearish bias in the short term. For now, selling pressure has remained strong, especially after the release of U.S. employment data, which reinforced a structural weakness in the U.S. dollar. Adding to this, this week’s inflation figures from Canada continue to support a neutral rate outlook from the Bank of Canada, allowing the Canadian dollar to maintain steady strength. If both factors persist, selling pressure may continue to dominate USD/CAD movements in the coming sessions.

What Happened with U.S. Employment Data?
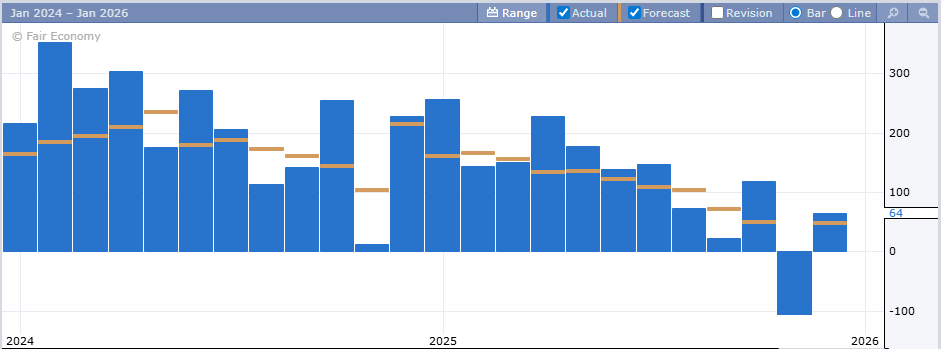
Today’s session included the release of NFP (Non-Farm Payrolls) data for October and November, which had been delayed due to the recent government shutdown. Although the most recent figure was positive — 64,000 jobs added, surpassing expectations of 50,000 — the October reading showed a significant drop of –100,000 jobs, indicating a sharp slowdown in the U.S. labor market.
Source: ForexFactory
Despite the mixed nature of the data, the Federal Reserve has not yet adjusted its outlook for the coming year. The negative October data justified last week’s rate cut, while the November rebound supports the idea that the central bank will maintain a neutral stance heading into January’s decision. What seems more evident is that the labor-market volatility suggests that rate hikes will not be considered in 2026; instead, the Fed may alternate between neutral rates and additional cuts to stabilize employment conditions.
However, the post-NFP landscape has not improved demand for the U.S. dollar. On one hand, labor data remains in a sensitive state, reducing the attractiveness of U.S. investments; on the other hand, the Federal Reserve has not provided clear signals about its direction for 2026, increasing overall market indecision and weakening Treasury bond stability. The lack of clarity diminishes foreign capital interest and limits demand for U.S. dollars.
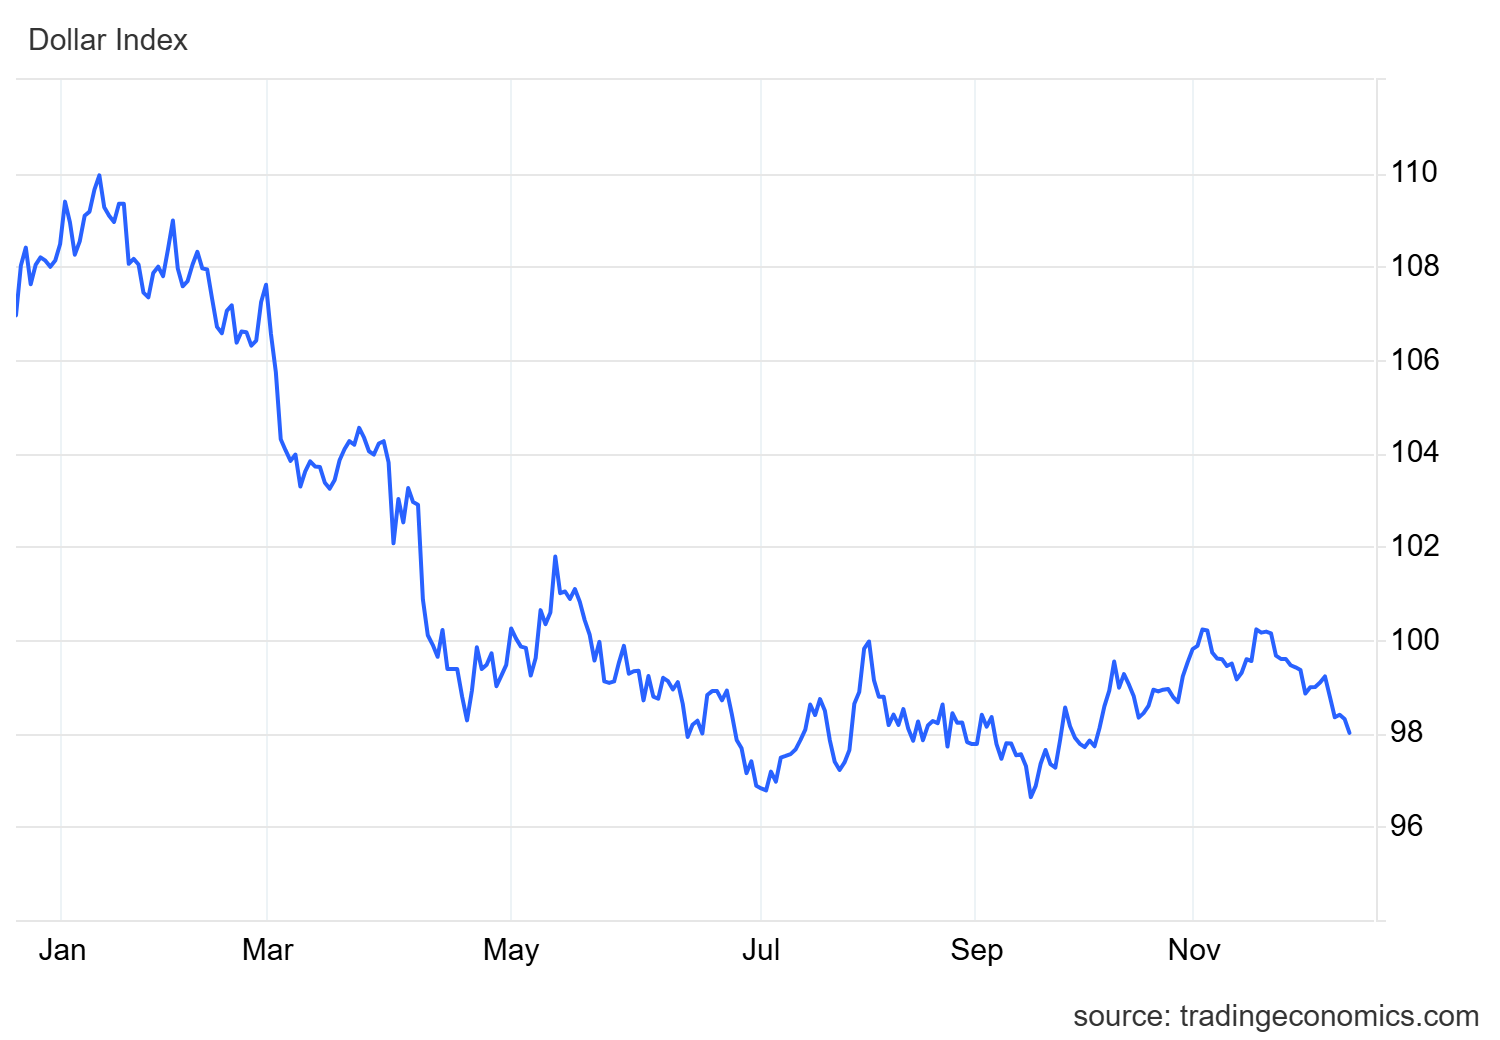
This weakness is reflected in the behavior of the DXY index, which measures the dollar’s strength against a basket of currencies. The DXY continues its consistent downtrend, trading below 100 points and moving toward the 98-point area—levels not seen since early October. This confirms a persistent decline in U.S. dollar strength in the short term.
Source: TradingEconomics
Taken together, these factors show that the employment data release generated more uncertainty than confidence regarding the U.S. economy. As long as this scenario persists, structural dollar weakness could continue benefiting the Canadian dollar, allowing it to gain ground consistently and strengthening selling pressure on USD/CAD in the sessions ahead.
Inflation in Canada
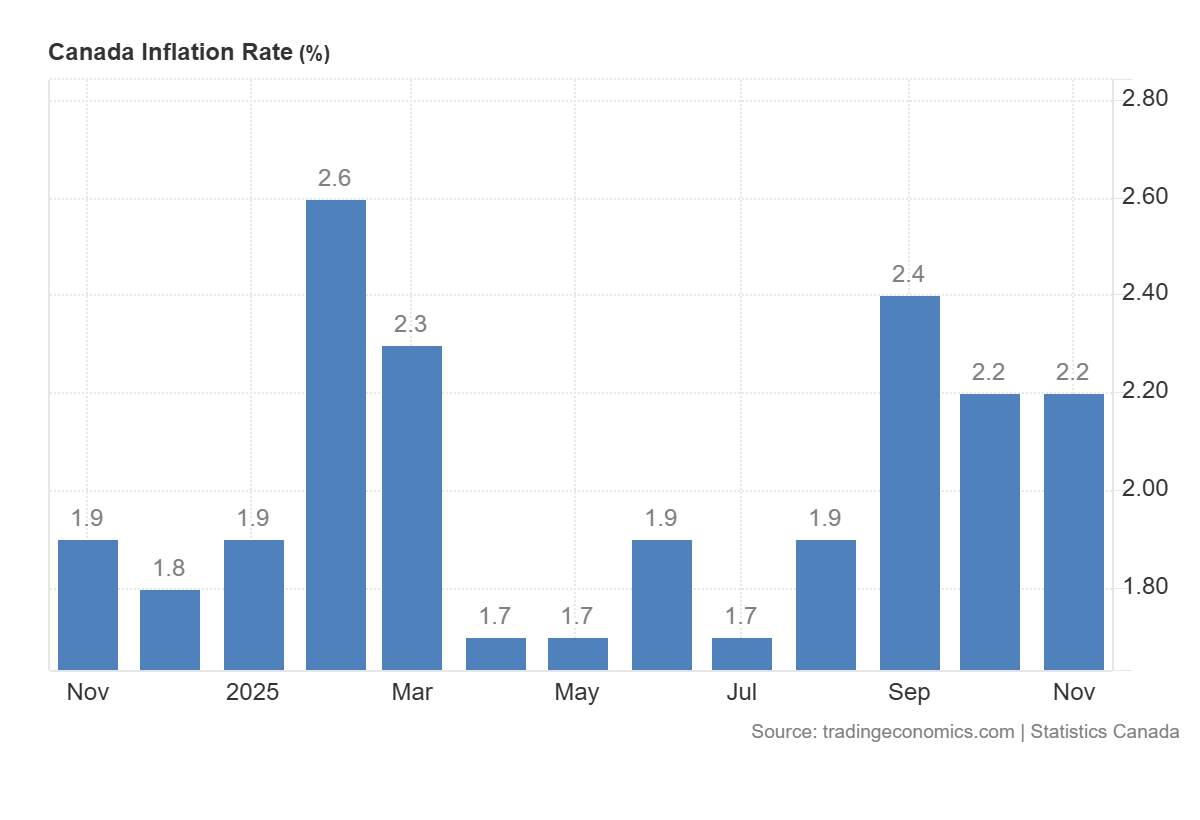
Canada’s CPI data was released this Monday, showing a neutral inflation reading. The headline rate remained at 2.2% for November, matching October’s reading. Although inflation has not shown recent increases, it remains slightly above the Bank of Canada’s 2% target, maintaining the need for continued monitoring.
Source: TradingEconomics
While the data does not suggest that the Bank of Canada will adopt an aggressive stance in 2026, it does point toward maintaining a neutral rate outlook. Compared with the potential for additional rate cuts from the Federal Reserve, a more stable rate environment in Canada could sustain the attractiveness of CAD-denominated investments, encouraging foreign capital inflows and supporting demand for the Canadian dollar in the short term.
If this neutral outlook persists, demand for CAD could remain consistent, becoming a key factor in maintaining steady selling pressure on USD/CAD over the medium term.
USD/CAD Technical Outlook
Source: StoneX, Tradingview
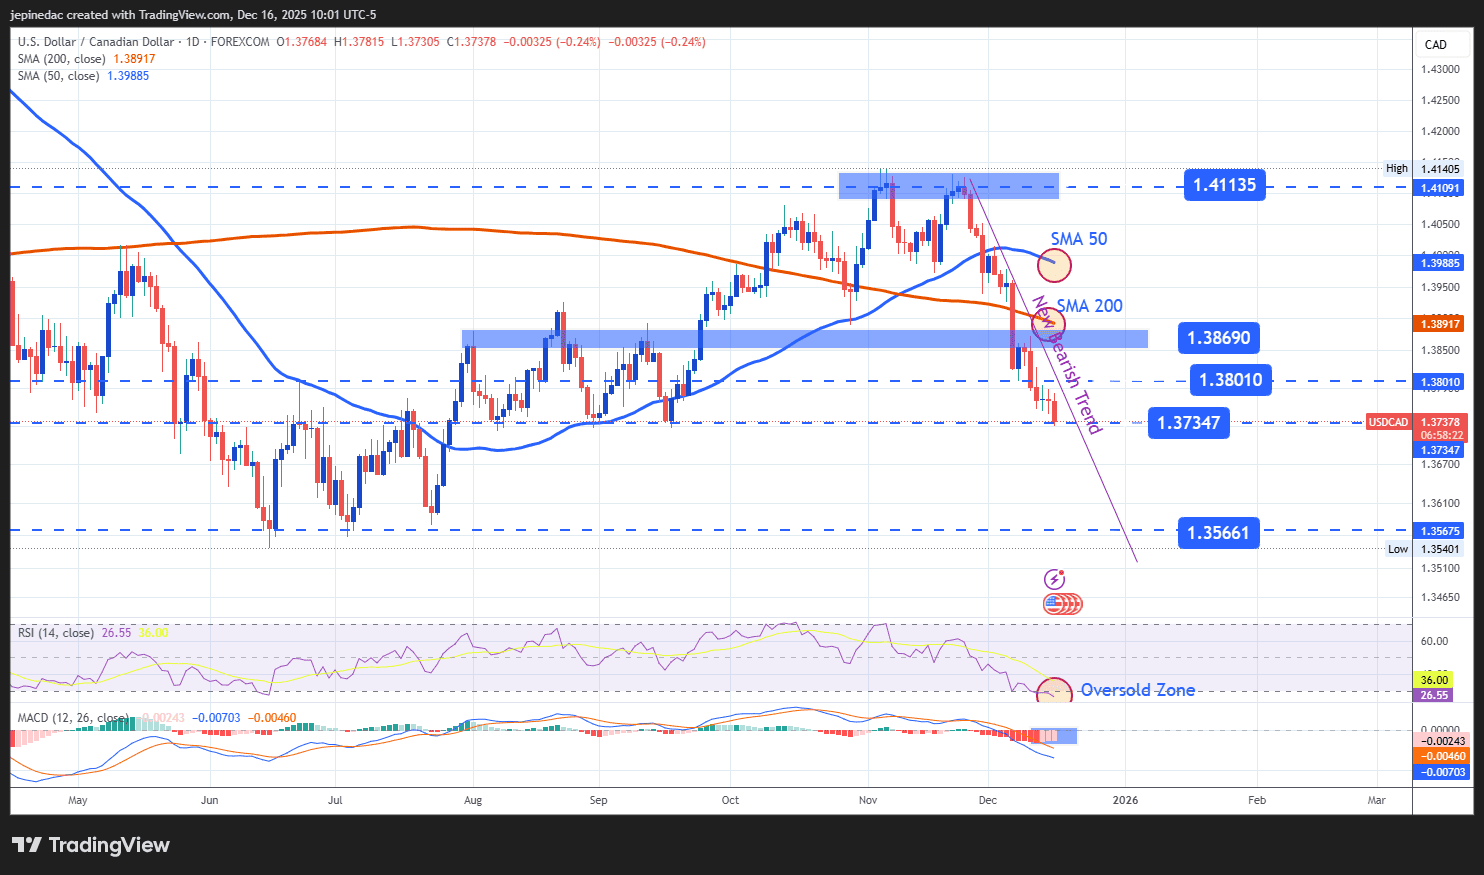
- A New Downtrend Emerges: Since the November highs, a new short-term downtrend has begun to take shape in USD/CAD price action. With no strong bullish corrections, this downtrend becomes the most relevant technical structure in the short term. However, due to recent aggressive selling pressure, short-term upward corrections could appear. While insufficient to break the downtrend, such moves could generate a brief bullish bias in the coming sessions.
- RSI: The RSI line continues to trade consistently below the 50 neutral level, reflecting the dominance of bearish momentum over the past 14 sessions. However, the indicator is approaching the oversold zone (30), which could signal a momentary imbalance caused by excessive selling pressure. This could open the door to short-term corrective upward movements.
- MACD: The MACD histogram remains below the zero line, reflecting the dominance of bearish strength in short-term moving averages. If this behavior continues, price may enter a period of indecision, allowing for more structured bullish corrections on the USD/CAD chart.
Key Levels:
- 1.38690 – Key Resistance: The highest neutrality level on the chart, aligned with the 200-period simple moving average. A move back toward this zone could reactivate a bullish bias and challenge the prevailing downtrend.
- 1.38010 – Current Barrier: A recent neutrality zone, which may act as resistance against short-term bullish corrections.
- 1.37347 – Crucial Support: A key retracement zone observed between August and September, and the most important bearish barrier. A break below it would reinforce the dominant selling bias and open the door to a deeper downtrend.
Written by Julian Pineda, CFA, CMT – Market Analyst
Follow him at: @julianpineda25




