


A new trading week begins, and USD/CAD shows an average variation of less than 0.1% in the short term amid growing indecision in the pair’s movements. This situation is mainly due to the ongoing U.S. government shutdown, which remains unresolved, leaving uncertainty about how much this event might start to affect the dollar’s strength in the short term. In addition, the lack of key economic data releases is creating uncertainty for the Federal Reserve’s decision-making process, which could eventually increase selling pressure on USD/CAD.

Where Does the Shutdown Stand?
It has now been six days since the U.S. government shutdown began, and there is still no concrete solution to this political impasse, which has started to generate market uncertainty. The White House and Congress have failed to reach an agreement to end the measure, and it is estimated that around 750,000 federal employees have been furloughed or are working without pay.
Given this situation, concerns are growing that the shutdown could drag on too long, similar to the one that took place in 2018–2019, which lasted 34 days. If a similar scenario unfolds, the cost to the U.S. economy could reach $3 billion.
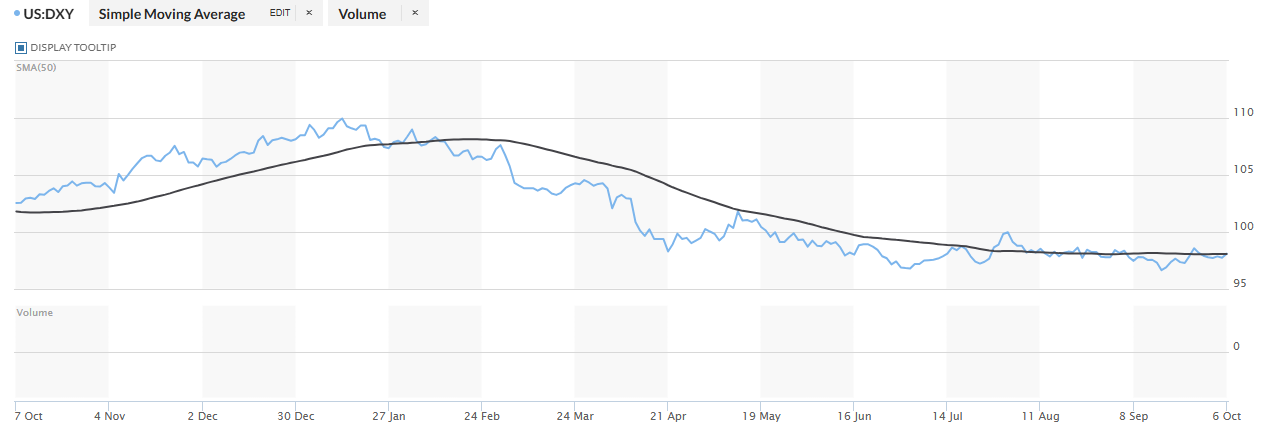
As a result, the market is starting to doubt the dollar’s ability to maintain its strength. The DXY index, which measures the dollar’s performance against a basket of currencies, is fluctuating around the 98-point level but without showing a consistent upward slope. On the contrary, the index has begun to reflect recurrent signs of indecision, suggesting that in the coming sessions, confidence in the dollar could weaken further.
Source: MarketWatch
In conclusion, if the U.S. government fails to reach an agreement soon, this event could undermine confidence in the dollar, creating room for the Canadian dollar to stage a more sustained recovery and generate stronger selling pressure on USD/CAD in the short term.
What’s Happening with the Central Banks?
Beyond the political uncertainty, the shutdown has prevented the release of key U.S. economic data, such as the Non-Farm Payrolls (NFP), which were scheduled for Friday, October 3. This complicates the Federal Reserve’s ability to make concrete monetary policy decisions and keeps the likelihood high that the central bank will continue its rate-cutting cycle.
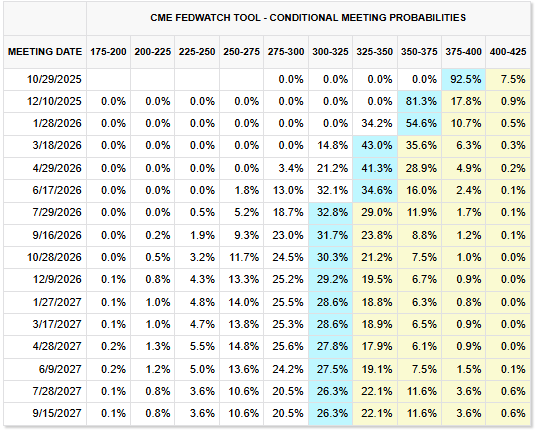
According to the CME Group, the probability of a 0.25% rate cut at the October 29 meeting stands at 92.5%, while the probability for the December 10 meeting is 81.3%. This suggests that the Fed will likely maintain a low-rate outlook as long as no new economic data points to a change in direction.
Source: CMEGROUP
In contrast, for the Bank of Canada, the path toward rate cuts is less clear. For the upcoming October decision, there is roughly a 55% probability that the bank will cut rates by 0.25%, while 45% of the market expects a neutral stance, meaning rates would remain unchanged.
As these dynamics between the two central banks evolve, they could become a key driver for USD/CAD movements. If the Federal Reserve maintains its low-rate policy amid limited data and the Bank of Canada refrains from following the same path in the short term, the interest rate differential between the two economies could continue narrowing. This would make U.S. dollar investments less attractive, allowing the Canadian dollar to strengthen further and exert downward pressure on USD/CAD in the coming sessions.
USD/CAD Technical Forecast
Source: StoneX, Tradingview
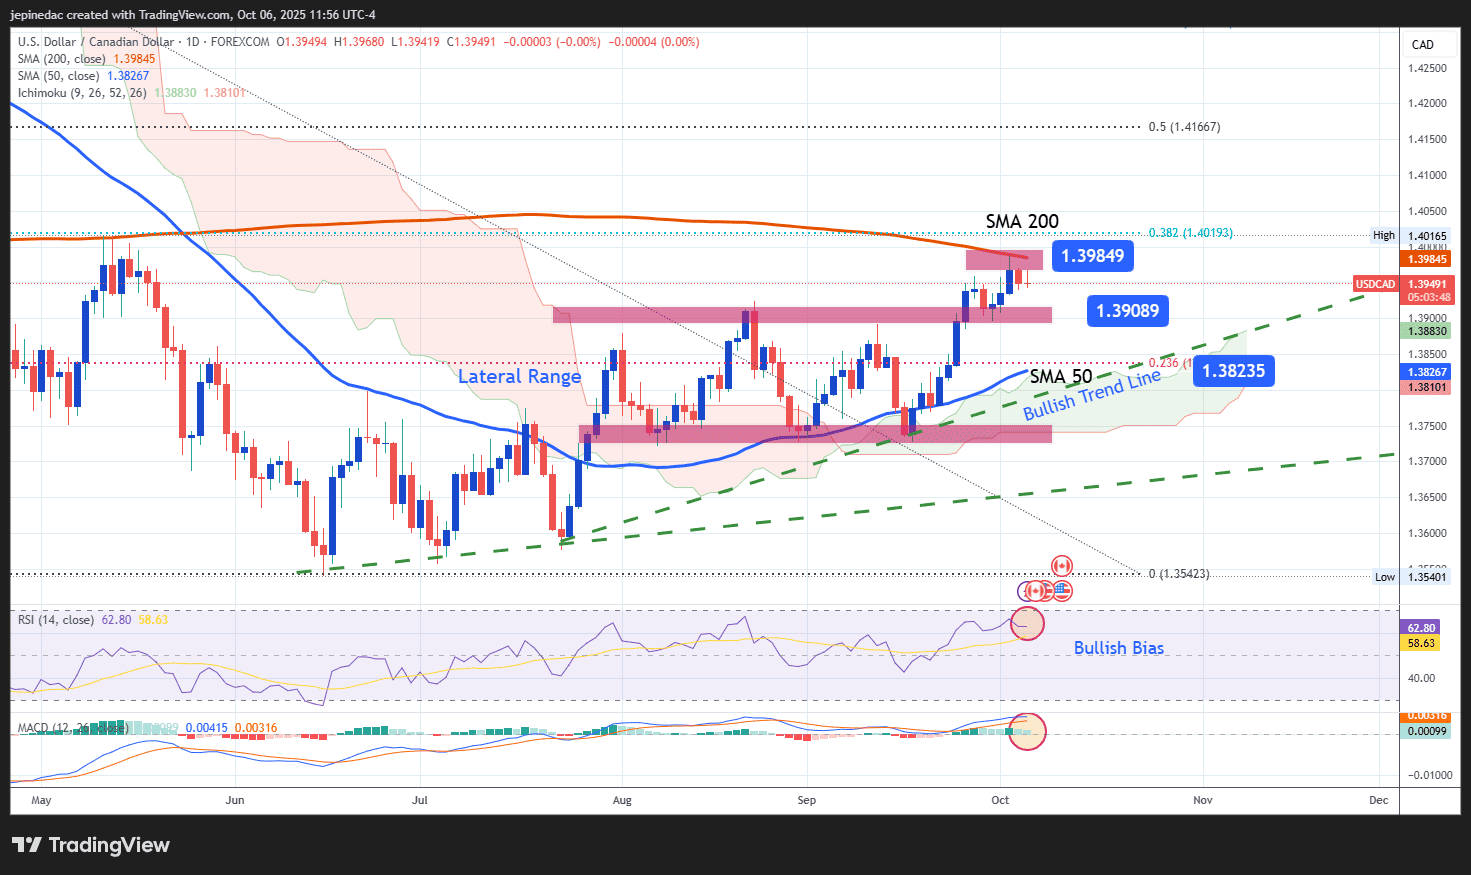
- Uptrend: Since late July, USD/CAD has maintained a steady upward trend, pushing prices toward the main resistance barrier at the 200-period simple moving average (SMA). The minor pullbacks seen so far are not strong enough to break the current bullish structure, although growing neutrality in price action could mark the beginning of a sideways range if buying momentum continues to fade.
- RSI: The RSI line remains oscillating above the 50 level, showing that buying momentum has dominated the last 14 sessions. However, repeated pullbacks toward the central level could signal increasing neutrality in the short term.
- MACD: The MACD histogram remains very close to the zero line, suggesting that short-term moving averages lack a clear direction. This reflects indecision within the extended bullish trend and could indicate that sideways movements may dominate the market in the coming sessions.
Key Levels:
- 1.39849 – Major Resistance: Aligned with the 200-period simple moving average, this level acts as the main barrier for short-term bullish moves. A sustained close above it could open the door to a more solid uptrend in the coming sessions.
- 1.39036 – Nearby Barrier: Intermediate support level corresponding to the former top of a lateral range formed in previous weeks. This zone could serve as a correction point amid recent price indecision.
- 1.38235 – Critical Support: Aligns with the 50-period simple moving average and the 23.6% Fibonacci retracement. A break below this level would put the current uptrend at risk and open the door to a dominant bearish bias in the coming sessions.
Written by Julian Pineda, CFA – Market Analyst
Follow him: @julianpineda25




